Indian (Asian) vs Latvian Median Male Earnings
COMPARE
Indian (Asian)
Latvian
Median Male Earnings
Median Male Earnings Comparison
Indians (Asian)
Latvians
$66,078
MEDIAN MALE EARNINGS
100.0/ 100
METRIC RATING
18th/ 347
METRIC RANK
$63,498
MEDIAN MALE EARNINGS
100.0/ 100
METRIC RATING
31st/ 347
METRIC RANK
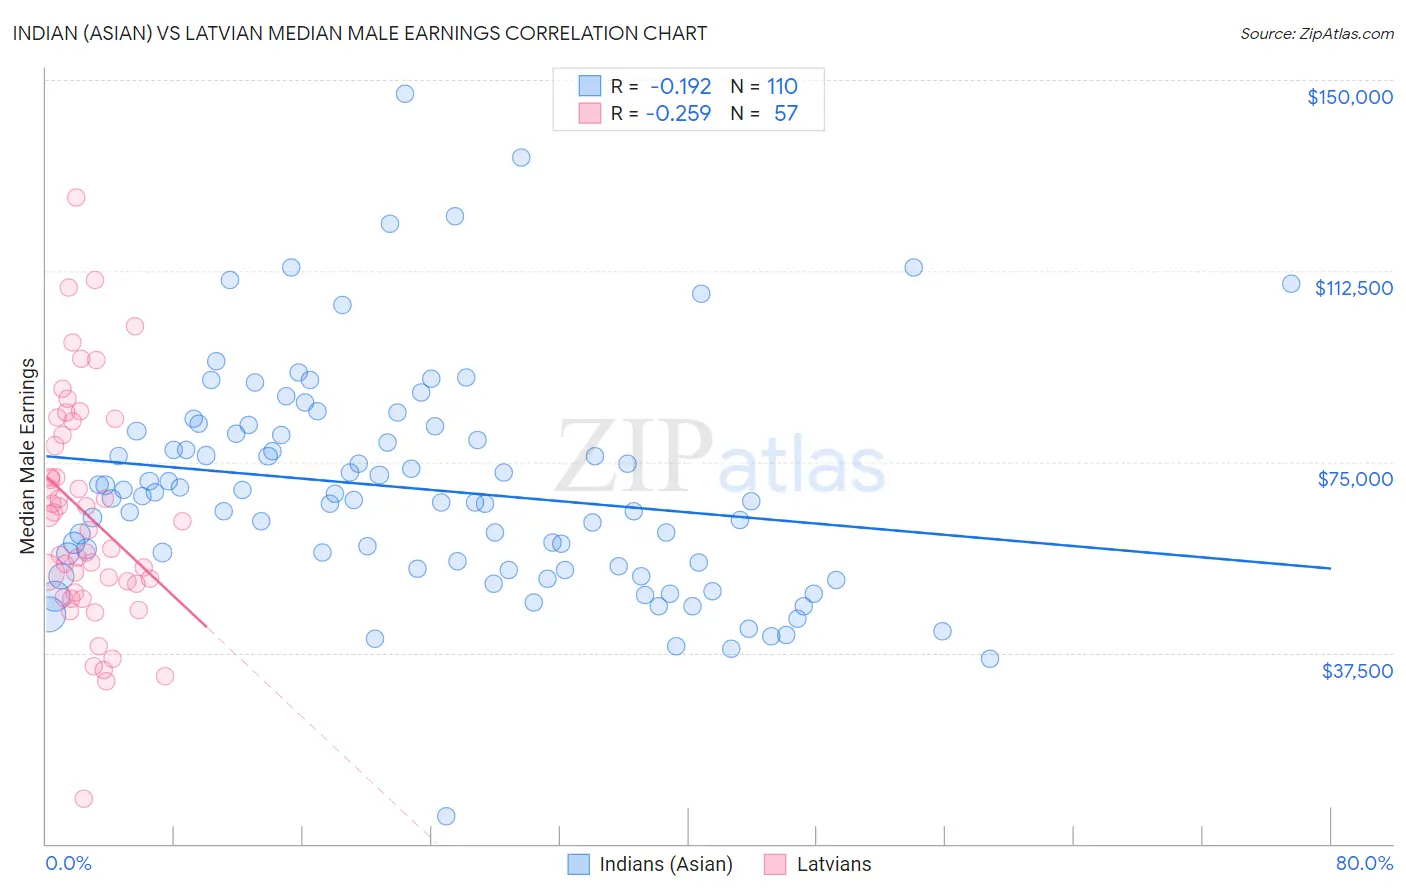
Indian (Asian) vs Latvian Median Male Earnings Correlation Chart
The statistical analysis conducted on geographies consisting of 494,843,397 people shows a poor negative correlation between the proportion of Indians (Asian) and median male earnings in the United States with a correlation coefficient (R) of -0.192 and weighted average of $66,078. Similarly, the statistical analysis conducted on geographies consisting of 220,682,058 people shows a weak negative correlation between the proportion of Latvians and median male earnings in the United States with a correlation coefficient (R) of -0.259 and weighted average of $63,498, a difference of 4.1%.
Median Male Earnings Correlation Summary
| Measurement | Indian (Asian) | Latvian |
| Minimum | $5,439 | $8,856 |
| Maximum | $147,267 | $126,871 |
| Range | $141,828 | $118,015 |
| Mean | $69,730 | $64,757 |
| Median | $67,689 | $63,438 |
| Interquartile 25% (IQ1) | $53,972 | $50,186 |
| Interquartile 75% (IQ3) | $80,584 | $81,584 |
| Interquartile Range (IQR) | $26,612 | $31,398 |
| Standard Deviation (Sample) | $22,146 | $22,394 |
| Standard Deviation (Population) | $22,045 | $22,197 |
Demographics Similar to Indians (Asian) and Latvians by Median Male Earnings
In terms of median male earnings, the demographic groups most similar to Indians (Asian) are Immigrants from Belgium ($66,125, a difference of 0.070%), Eastern European ($66,472, a difference of 0.60%), Cypriot ($65,549, a difference of 0.81%), Immigrants from Japan ($65,518, a difference of 0.85%), and Immigrants from Sweden ($65,406, a difference of 1.0%). Similarly, the demographic groups most similar to Latvians are Soviet Union ($63,382, a difference of 0.18%), Immigrants from Lithuania ($63,346, a difference of 0.24%), Immigrants from Russia ($63,326, a difference of 0.27%), Immigrants from France ($63,715, a difference of 0.34%), and Asian ($63,827, a difference of 0.52%).
| Demographics | Rating | Rank | Median Male Earnings |
| Okinawans | 100.0 /100 | #14 | Exceptional $67,232 |
| Immigrants | Eastern Asia | 100.0 /100 | #15 | Exceptional $66,903 |
| Eastern Europeans | 100.0 /100 | #16 | Exceptional $66,472 |
| Immigrants | Belgium | 100.0 /100 | #17 | Exceptional $66,125 |
| Indians (Asian) | 100.0 /100 | #18 | Exceptional $66,078 |
| Cypriots | 100.0 /100 | #19 | Exceptional $65,549 |
| Immigrants | Japan | 100.0 /100 | #20 | Exceptional $65,518 |
| Immigrants | Sweden | 100.0 /100 | #21 | Exceptional $65,406 |
| Burmese | 100.0 /100 | #22 | Exceptional $65,236 |
| Immigrants | Korea | 100.0 /100 | #23 | Exceptional $65,079 |
| Immigrants | Northern Europe | 100.0 /100 | #24 | Exceptional $64,987 |
| Immigrants | Denmark | 100.0 /100 | #25 | Exceptional $64,625 |
| Turks | 100.0 /100 | #26 | Exceptional $64,253 |
| Immigrants | Switzerland | 100.0 /100 | #27 | Exceptional $63,944 |
| Russians | 100.0 /100 | #28 | Exceptional $63,939 |
| Asians | 100.0 /100 | #29 | Exceptional $63,827 |
| Immigrants | France | 100.0 /100 | #30 | Exceptional $63,715 |
| Latvians | 100.0 /100 | #31 | Exceptional $63,498 |
| Soviet Union | 100.0 /100 | #32 | Exceptional $63,382 |
| Immigrants | Lithuania | 100.0 /100 | #33 | Exceptional $63,346 |
| Immigrants | Russia | 100.0 /100 | #34 | Exceptional $63,326 |