Immigrants from Zimbabwe vs Immigrants from Poland Single Female Poverty
COMPARE
Immigrants from Zimbabwe
Immigrants from Poland
Single Female Poverty
Single Female Poverty Comparison
Immigrants from Zimbabwe
Immigrants from Poland
20.0%
SINGLE FEMALE POVERTY
95.9/ 100
METRIC RATING
113th/ 347
METRIC RANK
18.5%
SINGLE FEMALE POVERTY
100.0/ 100
METRIC RATING
29th/ 347
METRIC RANK
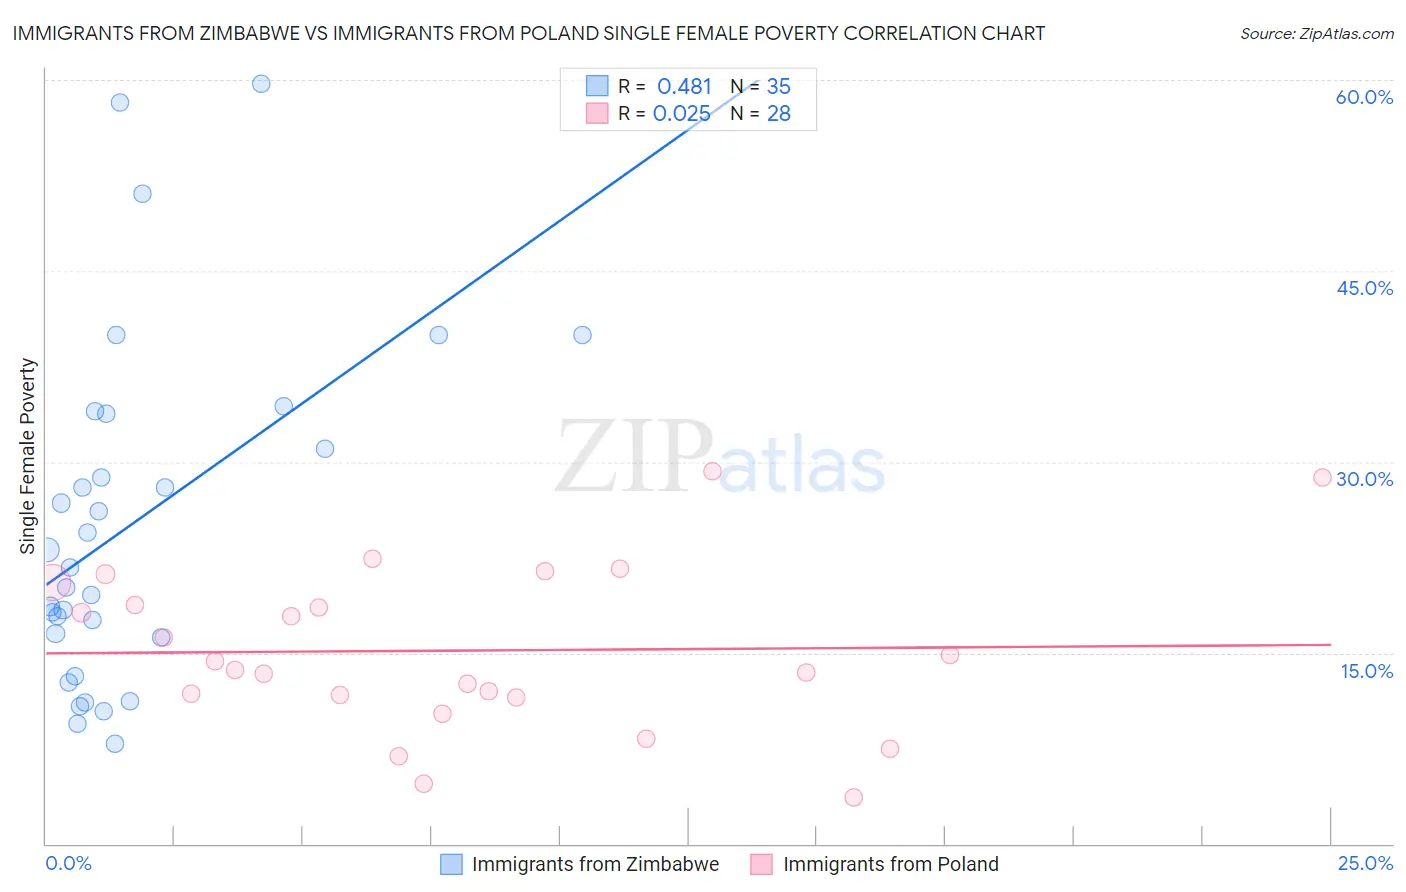
Immigrants from Zimbabwe vs Immigrants from Poland Single Female Poverty Correlation Chart
The statistical analysis conducted on geographies consisting of 117,320,666 people shows a moderate positive correlation between the proportion of Immigrants from Zimbabwe and poverty level among single females in the United States with a correlation coefficient (R) of 0.481 and weighted average of 20.0%. Similarly, the statistical analysis conducted on geographies consisting of 299,755,807 people shows no correlation between the proportion of Immigrants from Poland and poverty level among single females in the United States with a correlation coefficient (R) of 0.025 and weighted average of 18.5%, a difference of 7.9%.
Single Female Poverty Correlation Summary
| Measurement | Immigrants from Zimbabwe | Immigrants from Poland |
| Minimum | 7.9% | 3.7% |
| Maximum | 59.7% | 29.2% |
| Range | 51.9% | 25.6% |
| Mean | 25.1% | 15.2% |
| Median | 21.7% | 14.0% |
| Interquartile 25% (IQ1) | 16.2% | 11.6% |
| Interquartile 75% (IQ3) | 33.7% | 19.6% |
| Interquartile Range (IQR) | 17.6% | 8.0% |
| Standard Deviation (Sample) | 13.4% | 6.4% |
| Standard Deviation (Population) | 13.2% | 6.3% |
Similar Demographics by Single Female Poverty
Demographics Similar to Immigrants from Zimbabwe by Single Female Poverty
In terms of single female poverty, the demographic groups most similar to Immigrants from Zimbabwe are Immigrants from Colombia (20.0%, a difference of 0.0%), Immigrants from Northern Africa (20.0%, a difference of 0.020%), Immigrants from Netherlands (20.0%, a difference of 0.050%), Immigrants from Kazakhstan (20.0%, a difference of 0.060%), and Polish (20.0%, a difference of 0.10%).
| Demographics | Rating | Rank | Single Female Poverty |
| Ethiopians | 96.7 /100 | #106 | Exceptional 19.9% |
| Immigrants | Syria | 96.7 /100 | #107 | Exceptional 19.9% |
| Native Hawaiians | 96.6 /100 | #108 | Exceptional 19.9% |
| Colombians | 96.6 /100 | #109 | Exceptional 19.9% |
| Immigrants | Western Asia | 96.5 /100 | #110 | Exceptional 19.9% |
| Carpatho Rusyns | 96.1 /100 | #111 | Exceptional 20.0% |
| Immigrants | Netherlands | 96.0 /100 | #112 | Exceptional 20.0% |
| Immigrants | Zimbabwe | 95.9 /100 | #113 | Exceptional 20.0% |
| Immigrants | Colombia | 95.9 /100 | #114 | Exceptional 20.0% |
| Immigrants | Northern Africa | 95.8 /100 | #115 | Exceptional 20.0% |
| Immigrants | Kazakhstan | 95.7 /100 | #116 | Exceptional 20.0% |
| Poles | 95.6 /100 | #117 | Exceptional 20.0% |
| Immigrants | Afghanistan | 95.4 /100 | #118 | Exceptional 20.0% |
| Immigrants | Ethiopia | 95.4 /100 | #119 | Exceptional 20.0% |
| South Americans | 95.1 /100 | #120 | Exceptional 20.0% |
Demographics Similar to Immigrants from Poland by Single Female Poverty
In terms of single female poverty, the demographic groups most similar to Immigrants from Poland are Immigrants from Moldova (18.5%, a difference of 0.10%), Immigrants from North Macedonia (18.5%, a difference of 0.16%), Immigrants from Asia (18.6%, a difference of 0.21%), Immigrants from Sri Lanka (18.6%, a difference of 0.29%), and Immigrants from Philippines (18.6%, a difference of 0.36%).
| Demographics | Rating | Rank | Single Female Poverty |
| Burmese | 100.0 /100 | #22 | Exceptional 18.3% |
| Asians | 100.0 /100 | #23 | Exceptional 18.3% |
| Armenians | 100.0 /100 | #24 | Exceptional 18.3% |
| Immigrants | Singapore | 100.0 /100 | #25 | Exceptional 18.3% |
| Immigrants | Israel | 100.0 /100 | #26 | Exceptional 18.3% |
| Immigrants | Pakistan | 100.0 /100 | #27 | Exceptional 18.4% |
| Immigrants | Moldova | 100.0 /100 | #28 | Exceptional 18.5% |
| Immigrants | Poland | 100.0 /100 | #29 | Exceptional 18.5% |
| Immigrants | North Macedonia | 99.9 /100 | #30 | Exceptional 18.5% |
| Immigrants | Asia | 99.9 /100 | #31 | Exceptional 18.6% |
| Immigrants | Sri Lanka | 99.9 /100 | #32 | Exceptional 18.6% |
| Immigrants | Philippines | 99.9 /100 | #33 | Exceptional 18.6% |
| Koreans | 99.9 /100 | #34 | Exceptional 18.6% |
| Immigrants | Japan | 99.9 /100 | #35 | Exceptional 18.6% |
| Turks | 99.9 /100 | #36 | Exceptional 18.7% |