Immigrants from Zaire vs Yuman Family Poverty
COMPARE
Immigrants from Zaire
Yuman
Family Poverty
Family Poverty Comparison
Immigrants from Zaire
Yuman
10.7%
FAMILY POVERTY
0.3/ 100
METRIC RATING
252nd/ 347
METRIC RANK
16.6%
FAMILY POVERTY
0.0/ 100
METRIC RATING
339th/ 347
METRIC RANK
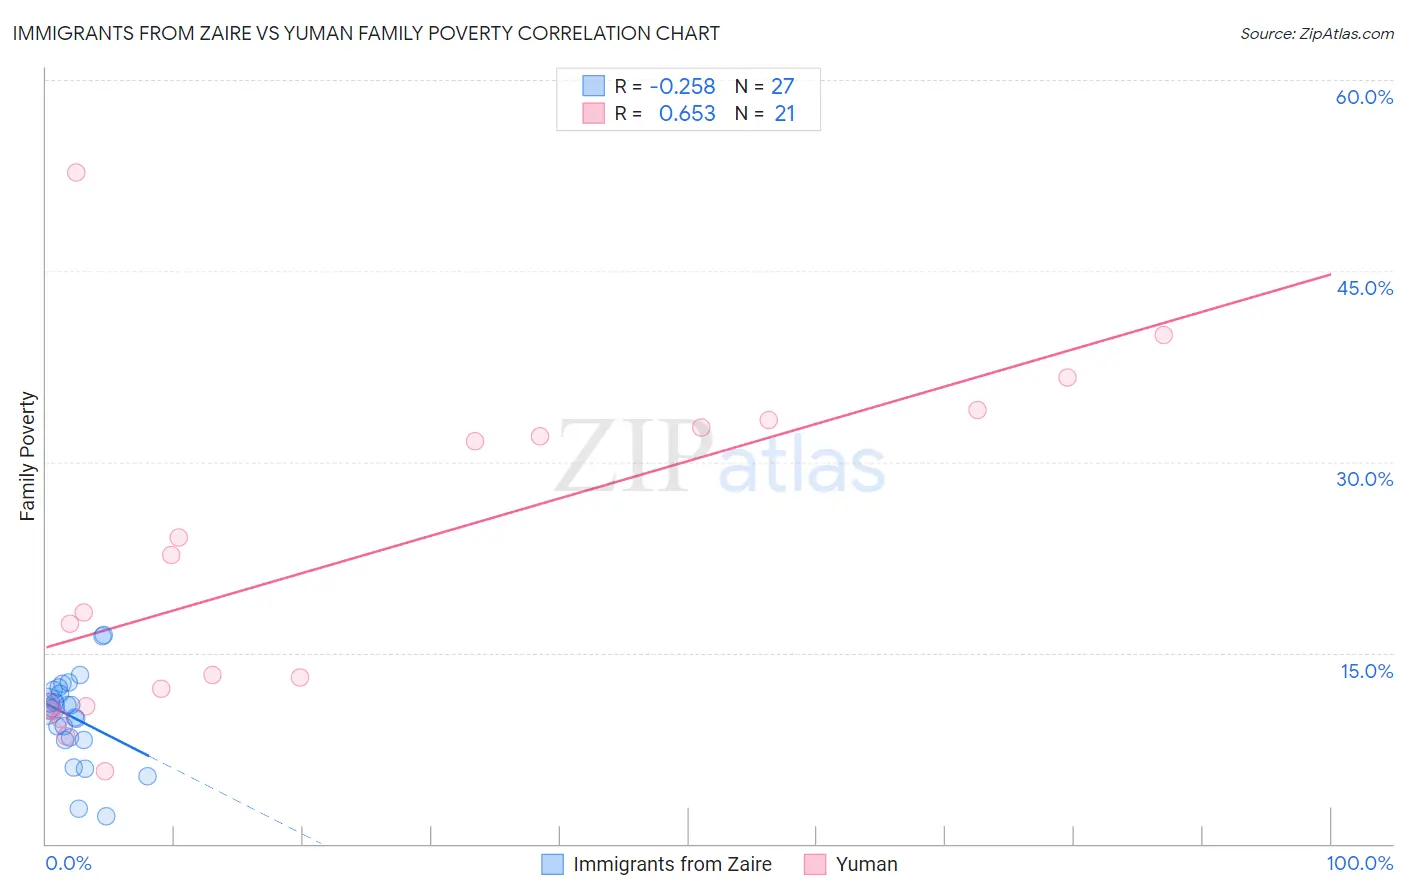
Immigrants from Zaire vs Yuman Family Poverty Correlation Chart
The statistical analysis conducted on geographies consisting of 107,226,893 people shows a weak negative correlation between the proportion of Immigrants from Zaire and poverty level among families in the United States with a correlation coefficient (R) of -0.258 and weighted average of 10.7%. Similarly, the statistical analysis conducted on geographies consisting of 40,648,846 people shows a significant positive correlation between the proportion of Yuman and poverty level among families in the United States with a correlation coefficient (R) of 0.653 and weighted average of 16.6%, a difference of 55.0%.
Family Poverty Correlation Summary
| Measurement | Immigrants from Zaire | Yuman |
| Minimum | 2.1% | 5.7% |
| Maximum | 16.4% | 52.7% |
| Range | 14.3% | 47.0% |
| Mean | 9.9% | 22.4% |
| Median | 10.6% | 18.2% |
| Interquartile 25% (IQ1) | 8.2% | 10.8% |
| Interquartile 75% (IQ3) | 12.1% | 33.0% |
| Interquartile Range (IQR) | 3.9% | 22.2% |
| Standard Deviation (Sample) | 3.4% | 12.9% |
| Standard Deviation (Population) | 3.4% | 12.6% |
Similar Demographics by Family Poverty
Demographics Similar to Immigrants from Zaire by Family Poverty
In terms of family poverty, the demographic groups most similar to Immigrants from Zaire are Immigrants from Western Africa (10.7%, a difference of 0.11%), Iroquois (10.7%, a difference of 0.12%), Salvadoran (10.7%, a difference of 0.40%), Ecuadorian (10.8%, a difference of 0.41%), and Immigrants from Liberia (10.8%, a difference of 0.78%).
| Demographics | Rating | Rank | Family Poverty |
| Immigrants | Burma/Myanmar | 0.6 /100 | #245 | Tragic 10.5% |
| Cherokee | 0.5 /100 | #246 | Tragic 10.6% |
| Liberians | 0.4 /100 | #247 | Tragic 10.6% |
| Nicaraguans | 0.4 /100 | #248 | Tragic 10.6% |
| Cubans | 0.4 /100 | #249 | Tragic 10.6% |
| Salvadorans | 0.3 /100 | #250 | Tragic 10.7% |
| Iroquois | 0.3 /100 | #251 | Tragic 10.7% |
| Immigrants | Zaire | 0.3 /100 | #252 | Tragic 10.7% |
| Immigrants | Western Africa | 0.3 /100 | #253 | Tragic 10.7% |
| Ecuadorians | 0.2 /100 | #254 | Tragic 10.8% |
| Immigrants | Liberia | 0.2 /100 | #255 | Tragic 10.8% |
| Chickasaw | 0.2 /100 | #256 | Tragic 10.8% |
| Immigrants | Ghana | 0.2 /100 | #257 | Tragic 10.8% |
| Sub-Saharan Africans | 0.2 /100 | #258 | Tragic 10.9% |
| Mexican American Indians | 0.2 /100 | #259 | Tragic 10.9% |
Demographics Similar to Yuman by Family Poverty
In terms of family poverty, the demographic groups most similar to Yuman are Pueblo (17.0%, a difference of 2.1%), Lumbee (17.0%, a difference of 2.1%), Crow (16.1%, a difference of 3.3%), Hopi (15.9%, a difference of 4.5%), and Sioux (15.9%, a difference of 5.0%).
| Demographics | Rating | Rank | Family Poverty |
| Dominicans | 0.0 /100 | #332 | Tragic 14.3% |
| Immigrants | Dominican Republic | 0.0 /100 | #333 | Tragic 14.4% |
| Houma | 0.0 /100 | #334 | Tragic 14.6% |
| Apache | 0.0 /100 | #335 | Tragic 14.7% |
| Sioux | 0.0 /100 | #336 | Tragic 15.9% |
| Hopi | 0.0 /100 | #337 | Tragic 15.9% |
| Crow | 0.0 /100 | #338 | Tragic 16.1% |
| Yuman | 0.0 /100 | #339 | Tragic 16.6% |
| Pueblo | 0.0 /100 | #340 | Tragic 17.0% |
| Lumbee | 0.0 /100 | #341 | Tragic 17.0% |
| Immigrants | Yemen | 0.0 /100 | #342 | Tragic 17.5% |
| Pima | 0.0 /100 | #343 | Tragic 18.4% |
| Yup'ik | 0.0 /100 | #344 | Tragic 18.7% |
| Navajo | 0.0 /100 | #345 | Tragic 18.8% |
| Puerto Ricans | 0.0 /100 | #346 | Tragic 20.3% |