Nonimmigrants vs Yuman Family Poverty
COMPARE
Nonimmigrants
Yuman
Family Poverty
Family Poverty Comparison
Nonimmigrants
Yuman
9.8%
FAMILY POVERTY
6.7/ 100
METRIC RATING
215th/ 347
METRIC RANK
16.6%
FAMILY POVERTY
0.0/ 100
METRIC RATING
339th/ 347
METRIC RANK
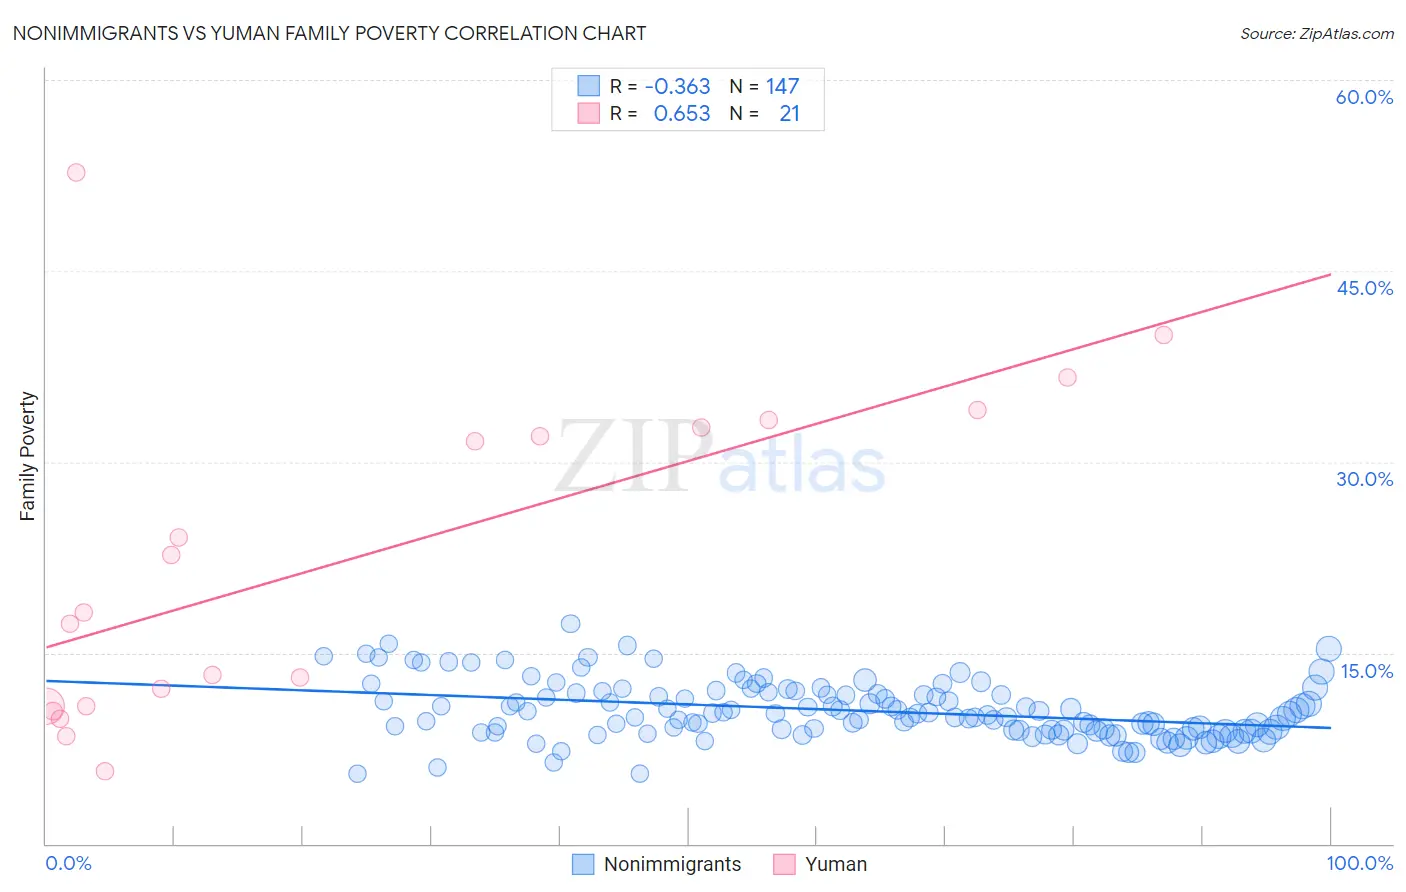
Nonimmigrants vs Yuman Family Poverty Correlation Chart
The statistical analysis conducted on geographies consisting of 578,873,352 people shows a mild negative correlation between the proportion of Nonimmigrants and poverty level among families in the United States with a correlation coefficient (R) of -0.363 and weighted average of 9.8%. Similarly, the statistical analysis conducted on geographies consisting of 40,648,846 people shows a significant positive correlation between the proportion of Yuman and poverty level among families in the United States with a correlation coefficient (R) of 0.653 and weighted average of 16.6%, a difference of 70.1%.
Family Poverty Correlation Summary
| Measurement | Nonimmigrants | Yuman |
| Minimum | 5.5% | 5.7% |
| Maximum | 17.3% | 52.7% |
| Range | 11.8% | 47.0% |
| Mean | 10.5% | 22.4% |
| Median | 10.2% | 18.2% |
| Interquartile 25% (IQ1) | 8.9% | 10.8% |
| Interquartile 75% (IQ3) | 11.8% | 33.0% |
| Interquartile Range (IQR) | 3.0% | 22.2% |
| Standard Deviation (Sample) | 2.2% | 12.9% |
| Standard Deviation (Population) | 2.2% | 12.6% |
Similar Demographics by Family Poverty
Demographics Similar to Nonimmigrants by Family Poverty
In terms of family poverty, the demographic groups most similar to Nonimmigrants are Immigrants from Micronesia (9.8%, a difference of 0.030%), Moroccan (9.8%, a difference of 0.060%), American (9.8%, a difference of 0.26%), Panamanian (9.8%, a difference of 0.58%), and Osage (9.7%, a difference of 0.61%).
| Demographics | Rating | Rank | Family Poverty |
| Immigrants | Eastern Africa | 15.1 /100 | #208 | Poor 9.5% |
| Immigrants | Uruguay | 14.0 /100 | #209 | Poor 9.5% |
| Alsatians | 11.3 /100 | #210 | Poor 9.6% |
| Malaysians | 10.6 /100 | #211 | Poor 9.6% |
| Immigrants | Thailand | 9.7 /100 | #212 | Tragic 9.7% |
| Osage | 8.0 /100 | #213 | Tragic 9.7% |
| Immigrants | Micronesia | 6.7 /100 | #214 | Tragic 9.8% |
| Immigrants | Nonimmigrants | 6.7 /100 | #215 | Tragic 9.8% |
| Moroccans | 6.5 /100 | #216 | Tragic 9.8% |
| Americans | 6.2 /100 | #217 | Tragic 9.8% |
| Panamanians | 5.6 /100 | #218 | Tragic 9.8% |
| Immigrants | Eritrea | 5.4 /100 | #219 | Tragic 9.9% |
| Bermudans | 5.3 /100 | #220 | Tragic 9.9% |
| Immigrants | Cambodia | 4.8 /100 | #221 | Tragic 9.9% |
| Japanese | 4.8 /100 | #222 | Tragic 9.9% |
Demographics Similar to Yuman by Family Poverty
In terms of family poverty, the demographic groups most similar to Yuman are Pueblo (17.0%, a difference of 2.1%), Lumbee (17.0%, a difference of 2.1%), Crow (16.1%, a difference of 3.3%), Hopi (15.9%, a difference of 4.5%), and Sioux (15.9%, a difference of 5.0%).
| Demographics | Rating | Rank | Family Poverty |
| Dominicans | 0.0 /100 | #332 | Tragic 14.3% |
| Immigrants | Dominican Republic | 0.0 /100 | #333 | Tragic 14.4% |
| Houma | 0.0 /100 | #334 | Tragic 14.6% |
| Apache | 0.0 /100 | #335 | Tragic 14.7% |
| Sioux | 0.0 /100 | #336 | Tragic 15.9% |
| Hopi | 0.0 /100 | #337 | Tragic 15.9% |
| Crow | 0.0 /100 | #338 | Tragic 16.1% |
| Yuman | 0.0 /100 | #339 | Tragic 16.6% |
| Pueblo | 0.0 /100 | #340 | Tragic 17.0% |
| Lumbee | 0.0 /100 | #341 | Tragic 17.0% |
| Immigrants | Yemen | 0.0 /100 | #342 | Tragic 17.5% |
| Pima | 0.0 /100 | #343 | Tragic 18.4% |
| Yup'ik | 0.0 /100 | #344 | Tragic 18.7% |
| Navajo | 0.0 /100 | #345 | Tragic 18.8% |
| Puerto Ricans | 0.0 /100 | #346 | Tragic 20.3% |