Immigrants from Yemen vs White/Caucasian 2nd Grade
COMPARE
Immigrants from Yemen
White/Caucasian
2nd Grade
2nd Grade Comparison
Immigrants from Yemen
Whites/Caucasians
95.7%
2ND GRADE
0.0/ 100
METRIC RATING
346th/ 347
METRIC RANK
98.4%
2ND GRADE
99.8/ 100
METRIC RATING
50th/ 347
METRIC RANK
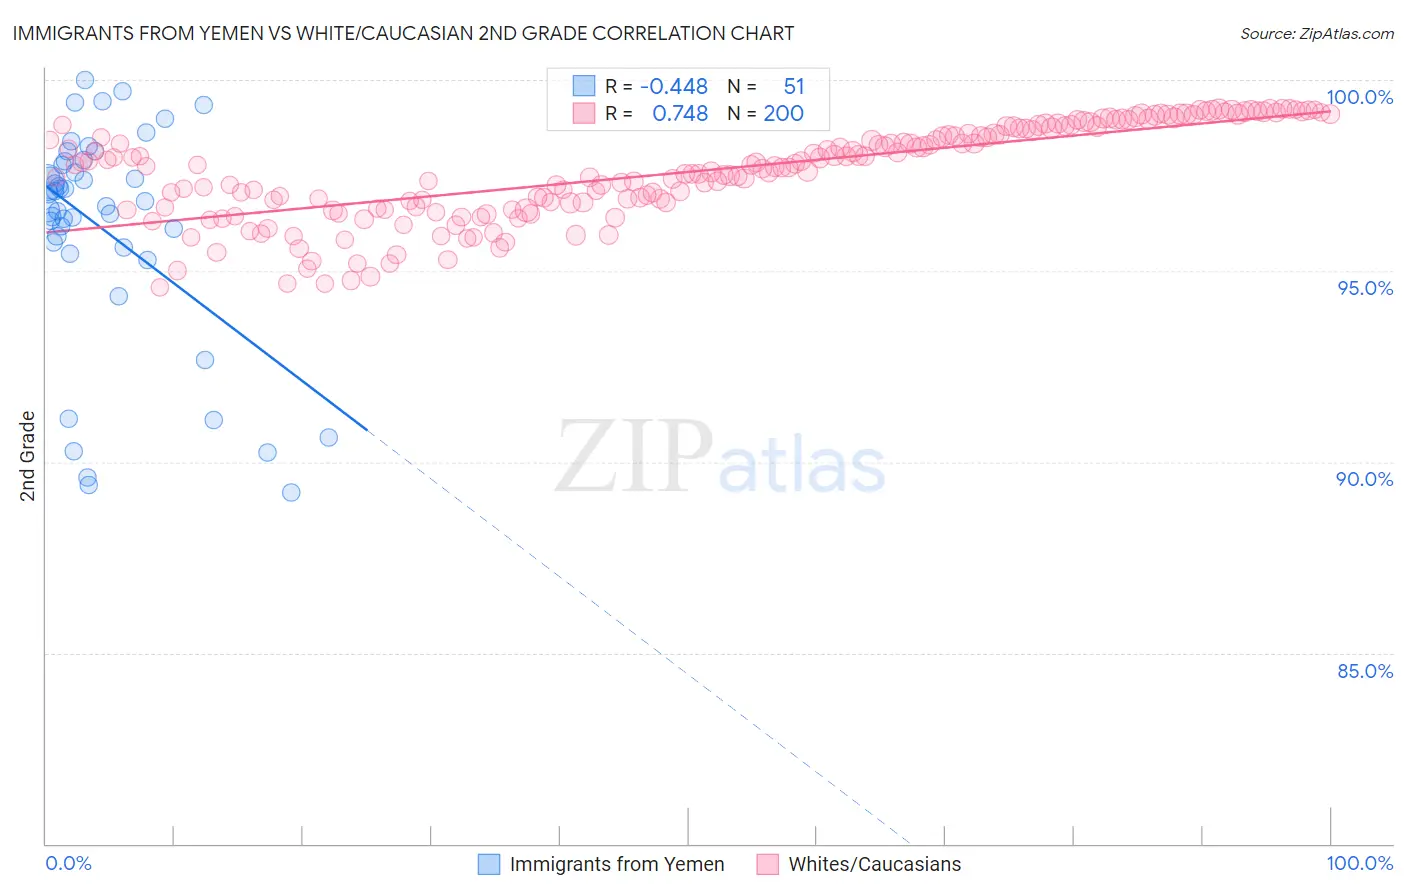
Immigrants from Yemen vs White/Caucasian 2nd Grade Correlation Chart
The statistical analysis conducted on geographies consisting of 82,433,611 people shows a moderate negative correlation between the proportion of Immigrants from Yemen and percentage of population with at least 2nd grade education in the United States with a correlation coefficient (R) of -0.448 and weighted average of 95.7%. Similarly, the statistical analysis conducted on geographies consisting of 585,247,393 people shows a strong positive correlation between the proportion of Whites/Caucasians and percentage of population with at least 2nd grade education in the United States with a correlation coefficient (R) of 0.748 and weighted average of 98.4%, a difference of 2.8%.
2nd Grade Correlation Summary
| Measurement | Immigrants from Yemen | White/Caucasian |
| Minimum | 89.2% | 94.6% |
| Maximum | 100.0% | 99.3% |
| Range | 10.8% | 4.7% |
| Mean | 96.1% | 97.6% |
| Median | 96.8% | 97.7% |
| Interquartile 25% (IQ1) | 95.6% | 96.7% |
| Interquartile 75% (IQ3) | 97.9% | 98.7% |
| Interquartile Range (IQR) | 2.3% | 2.1% |
| Standard Deviation (Sample) | 2.9% | 1.2% |
| Standard Deviation (Population) | 2.9% | 1.2% |
Similar Demographics by 2nd Grade
Demographics Similar to Immigrants from Yemen by 2nd Grade
In terms of 2nd grade, the demographic groups most similar to Immigrants from Yemen are Immigrants from El Salvador (95.9%, a difference of 0.14%), Spanish American Indian (95.6%, a difference of 0.18%), Salvadoran (96.0%, a difference of 0.31%), Nepalese (96.1%, a difference of 0.34%), and Immigrants from Mexico (96.1%, a difference of 0.43%).
| Demographics | Rating | Rank | 2nd Grade |
| Immigrants | Dominican Republic | 0.0 /100 | #333 | Tragic 96.4% |
| Central Americans | 0.0 /100 | #334 | Tragic 96.4% |
| Yakama | 0.0 /100 | #335 | Tragic 96.4% |
| Immigrants | Fiji | 0.0 /100 | #336 | Tragic 96.4% |
| Immigrants | Cambodia | 0.0 /100 | #337 | Tragic 96.4% |
| Immigrants | Cabo Verde | 0.0 /100 | #338 | Tragic 96.3% |
| Guatemalans | 0.0 /100 | #339 | Tragic 96.3% |
| Immigrants | Guatemala | 0.0 /100 | #340 | Tragic 96.2% |
| Immigrants | Central America | 0.0 /100 | #341 | Tragic 96.2% |
| Immigrants | Mexico | 0.0 /100 | #342 | Tragic 96.1% |
| Nepalese | 0.0 /100 | #343 | Tragic 96.1% |
| Salvadorans | 0.0 /100 | #344 | Tragic 96.0% |
| Immigrants | El Salvador | 0.0 /100 | #345 | Tragic 95.9% |
| Immigrants | Yemen | 0.0 /100 | #346 | Tragic 95.7% |
| Spanish American Indians | 0.0 /100 | #347 | Tragic 95.6% |
Demographics Similar to Whites/Caucasians by 2nd Grade
In terms of 2nd grade, the demographic groups most similar to Whites/Caucasians are Celtic (98.4%, a difference of 0.0%), Estonian (98.4%, a difference of 0.0%), Australian (98.4%, a difference of 0.0%), Czechoslovakian (98.4%, a difference of 0.010%), and Pueblo (98.3%, a difference of 0.010%).
| Demographics | Rating | Rank | 2nd Grade |
| Belgians | 99.9 /100 | #43 | Exceptional 98.4% |
| Northern Europeans | 99.9 /100 | #44 | Exceptional 98.4% |
| Hungarians | 99.9 /100 | #45 | Exceptional 98.4% |
| Lumbee | 99.9 /100 | #46 | Exceptional 98.4% |
| Ottawa | 99.9 /100 | #47 | Exceptional 98.4% |
| Czechoslovakians | 99.9 /100 | #48 | Exceptional 98.4% |
| Celtics | 99.8 /100 | #49 | Exceptional 98.4% |
| Whites/Caucasians | 99.8 /100 | #50 | Exceptional 98.4% |
| Estonians | 99.8 /100 | #51 | Exceptional 98.4% |
| Australians | 99.8 /100 | #52 | Exceptional 98.4% |
| Pueblo | 99.8 /100 | #53 | Exceptional 98.3% |
| Kiowa | 99.8 /100 | #54 | Exceptional 98.3% |
| Immigrants | Scotland | 99.8 /100 | #55 | Exceptional 98.3% |
| Americans | 99.8 /100 | #56 | Exceptional 98.3% |
| Austrians | 99.8 /100 | #57 | Exceptional 98.3% |