Immigrants from Western Europe vs Immigrants from England Male Poverty
COMPARE
Immigrants from Western Europe
Immigrants from England
Male Poverty
Male Poverty Comparison
Immigrants from Western Europe
Immigrants from England
10.7%
MALE POVERTY
84.2/ 100
METRIC RATING
128th/ 347
METRIC RANK
10.4%
MALE POVERTY
95.5/ 100
METRIC RATING
85th/ 347
METRIC RANK
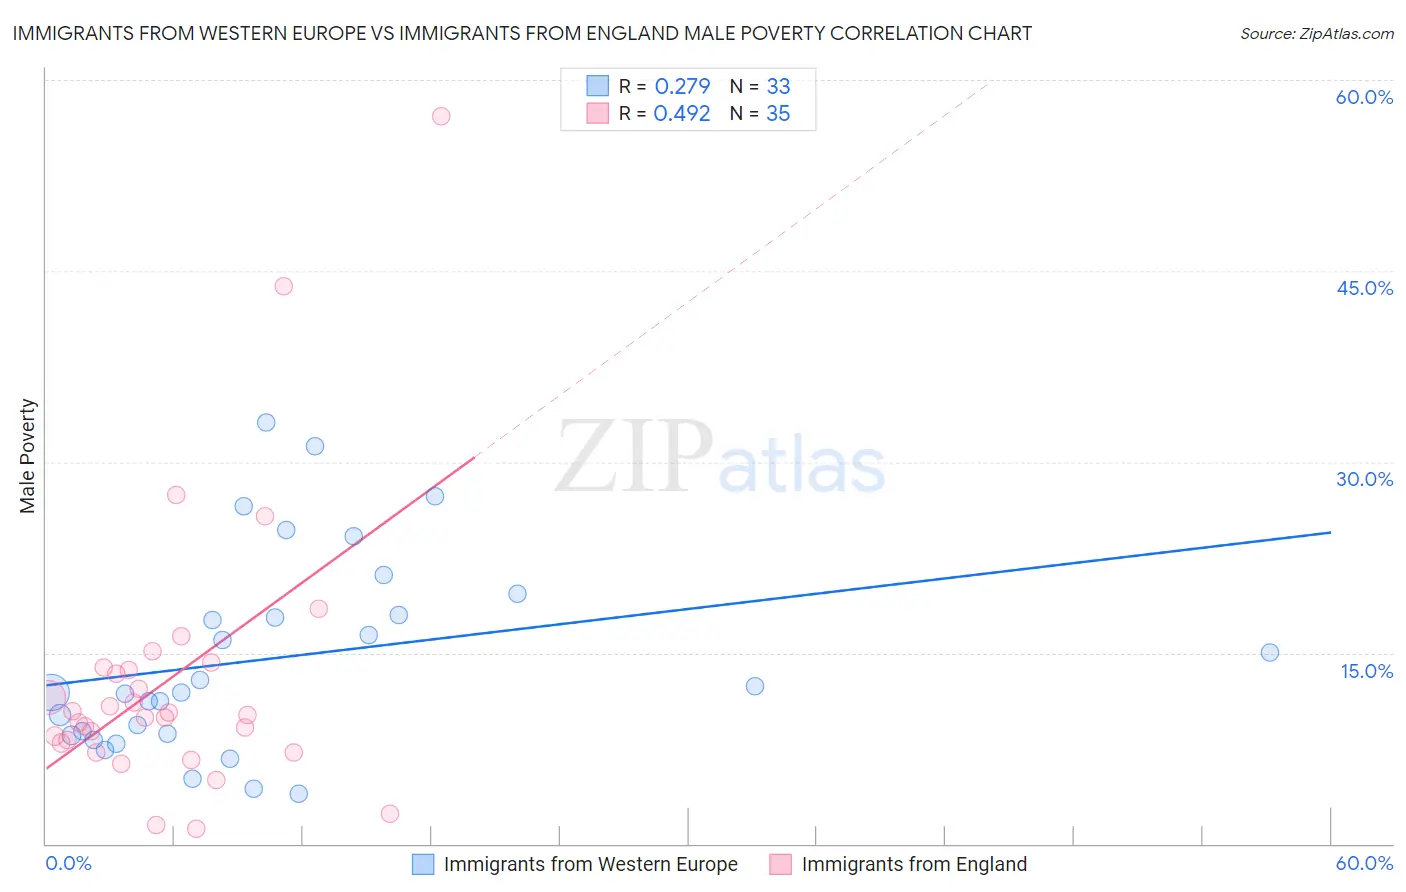
Immigrants from Western Europe vs Immigrants from England Male Poverty Correlation Chart
The statistical analysis conducted on geographies consisting of 493,468,603 people shows a weak positive correlation between the proportion of Immigrants from Western Europe and poverty level among males in the United States with a correlation coefficient (R) of 0.279 and weighted average of 10.7%. Similarly, the statistical analysis conducted on geographies consisting of 391,609,977 people shows a moderate positive correlation between the proportion of Immigrants from England and poverty level among males in the United States with a correlation coefficient (R) of 0.492 and weighted average of 10.4%, a difference of 3.7%.
Male Poverty Correlation Summary
| Measurement | Immigrants from Western Europe | Immigrants from England |
| Minimum | 3.9% | 1.2% |
| Maximum | 33.1% | 57.1% |
| Range | 29.2% | 55.9% |
| Mean | 14.6% | 13.0% |
| Median | 11.9% | 10.2% |
| Interquartile 25% (IQ1) | 8.6% | 7.9% |
| Interquartile 75% (IQ3) | 18.8% | 13.9% |
| Interquartile Range (IQR) | 10.2% | 5.9% |
| Standard Deviation (Sample) | 7.8% | 11.0% |
| Standard Deviation (Population) | 7.7% | 10.8% |
Similar Demographics by Male Poverty
Demographics Similar to Immigrants from Western Europe by Male Poverty
In terms of male poverty, the demographic groups most similar to Immigrants from Western Europe are Immigrants from Peru (10.7%, a difference of 0.010%), Immigrants from Ukraine (10.7%, a difference of 0.020%), Puget Sound Salish (10.7%, a difference of 0.020%), Chilean (10.7%, a difference of 0.060%), and Immigrants from Belarus (10.7%, a difference of 0.17%).
| Demographics | Rating | Rank | Male Poverty |
| Peruvians | 87.1 /100 | #121 | Excellent 10.7% |
| Native Hawaiians | 87.0 /100 | #122 | Excellent 10.7% |
| South Africans | 86.8 /100 | #123 | Excellent 10.7% |
| French | 86.7 /100 | #124 | Excellent 10.7% |
| Immigrants | Norway | 86.0 /100 | #125 | Excellent 10.7% |
| Immigrants | Ukraine | 84.3 /100 | #126 | Excellent 10.7% |
| Puget Sound Salish | 84.3 /100 | #127 | Excellent 10.7% |
| Immigrants | Western Europe | 84.2 /100 | #128 | Excellent 10.7% |
| Immigrants | Peru | 84.1 /100 | #129 | Excellent 10.7% |
| Chileans | 83.9 /100 | #130 | Excellent 10.7% |
| Immigrants | Belarus | 83.3 /100 | #131 | Excellent 10.7% |
| Immigrants | Vietnam | 83.0 /100 | #132 | Excellent 10.8% |
| Pakistanis | 83.0 /100 | #133 | Excellent 10.8% |
| New Zealanders | 82.9 /100 | #134 | Excellent 10.8% |
| Brazilians | 82.7 /100 | #135 | Excellent 10.8% |
Demographics Similar to Immigrants from England by Male Poverty
In terms of male poverty, the demographic groups most similar to Immigrants from England are Czechoslovakian (10.3%, a difference of 0.050%), Immigrants from Sweden (10.3%, a difference of 0.11%), Immigrants from Eastern Asia (10.4%, a difference of 0.13%), Northern European (10.4%, a difference of 0.17%), and Egyptian (10.3%, a difference of 0.23%).
| Demographics | Rating | Rank | Male Poverty |
| Irish | 96.8 /100 | #78 | Exceptional 10.3% |
| Immigrants | North America | 96.5 /100 | #79 | Exceptional 10.3% |
| English | 96.4 /100 | #80 | Exceptional 10.3% |
| Belgians | 95.9 /100 | #81 | Exceptional 10.3% |
| Egyptians | 95.9 /100 | #82 | Exceptional 10.3% |
| Immigrants | Sweden | 95.7 /100 | #83 | Exceptional 10.3% |
| Czechoslovakians | 95.6 /100 | #84 | Exceptional 10.3% |
| Immigrants | England | 95.5 /100 | #85 | Exceptional 10.4% |
| Immigrants | Eastern Asia | 95.3 /100 | #86 | Exceptional 10.4% |
| Northern Europeans | 95.2 /100 | #87 | Exceptional 10.4% |
| Cambodians | 95.0 /100 | #88 | Exceptional 10.4% |
| Immigrants | Denmark | 95.0 /100 | #89 | Exceptional 10.4% |
| Indians (Asian) | 94.9 /100 | #90 | Exceptional 10.4% |
| British | 94.8 /100 | #91 | Exceptional 10.4% |
| Jordanians | 94.4 /100 | #92 | Exceptional 10.4% |