Immigrants from Syria vs Immigrants from England Male Poverty
COMPARE
Immigrants from Syria
Immigrants from England
Male Poverty
Male Poverty Comparison
Immigrants from Syria
Immigrants from England
11.3%
MALE POVERTY
40.3/ 100
METRIC RATING
179th/ 347
METRIC RANK
10.4%
MALE POVERTY
95.5/ 100
METRIC RATING
85th/ 347
METRIC RANK
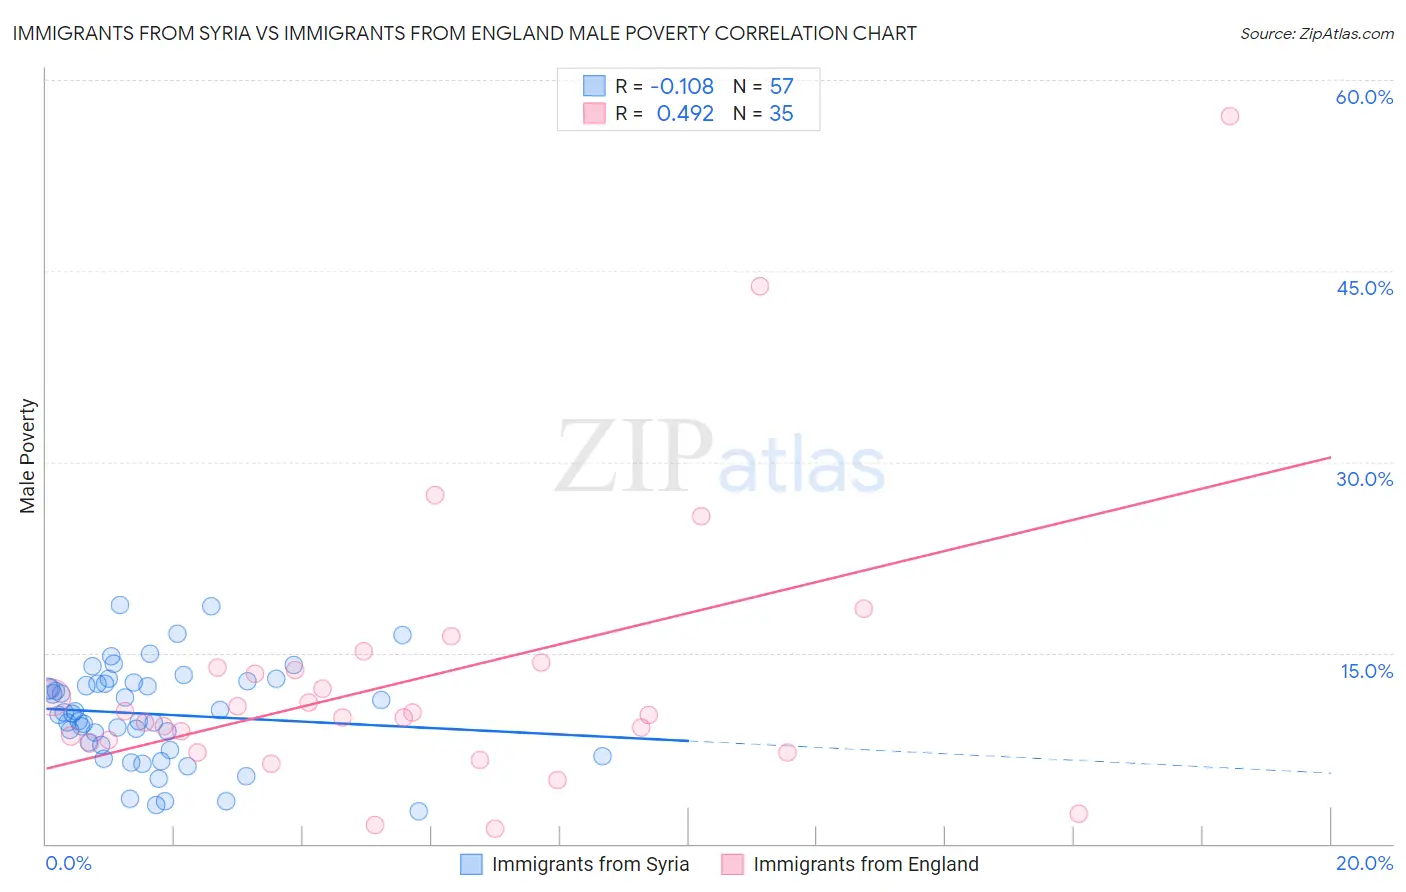
Immigrants from Syria vs Immigrants from England Male Poverty Correlation Chart
The statistical analysis conducted on geographies consisting of 173,977,512 people shows a poor negative correlation between the proportion of Immigrants from Syria and poverty level among males in the United States with a correlation coefficient (R) of -0.108 and weighted average of 11.3%. Similarly, the statistical analysis conducted on geographies consisting of 391,609,977 people shows a moderate positive correlation between the proportion of Immigrants from England and poverty level among males in the United States with a correlation coefficient (R) of 0.492 and weighted average of 10.4%, a difference of 9.1%.
Male Poverty Correlation Summary
| Measurement | Immigrants from Syria | Immigrants from England |
| Minimum | 2.5% | 1.2% |
| Maximum | 18.7% | 57.1% |
| Range | 16.2% | 55.9% |
| Mean | 10.2% | 13.0% |
| Median | 10.2% | 10.2% |
| Interquartile 25% (IQ1) | 7.6% | 7.9% |
| Interquartile 75% (IQ3) | 12.6% | 13.9% |
| Interquartile Range (IQR) | 5.0% | 5.9% |
| Standard Deviation (Sample) | 3.8% | 11.0% |
| Standard Deviation (Population) | 3.7% | 10.8% |
Similar Demographics by Male Poverty
Demographics Similar to Immigrants from Syria by Male Poverty
In terms of male poverty, the demographic groups most similar to Immigrants from Syria are Immigrants from Morocco (11.3%, a difference of 0.010%), Immigrants from Costa Rica (11.3%, a difference of 0.080%), Mongolian (11.3%, a difference of 0.13%), Kenyan (11.3%, a difference of 0.19%), and Immigrants from South America (11.3%, a difference of 0.34%).
| Demographics | Rating | Rank | Male Poverty |
| Immigrants | Ethiopia | 50.7 /100 | #172 | Average 11.2% |
| Pennsylvania Germans | 50.5 /100 | #173 | Average 11.2% |
| Immigrants | Oceania | 50.0 /100 | #174 | Average 11.2% |
| Celtics | 47.5 /100 | #175 | Average 11.2% |
| Immigrants | Fiji | 46.0 /100 | #176 | Average 11.2% |
| Lebanese | 45.6 /100 | #177 | Average 11.2% |
| Immigrants | Cameroon | 44.5 /100 | #178 | Average 11.2% |
| Immigrants | Syria | 40.3 /100 | #179 | Average 11.3% |
| Immigrants | Morocco | 40.1 /100 | #180 | Average 11.3% |
| Immigrants | Costa Rica | 39.5 /100 | #181 | Fair 11.3% |
| Mongolians | 39.0 /100 | #182 | Fair 11.3% |
| Kenyans | 38.4 /100 | #183 | Fair 11.3% |
| Immigrants | South America | 36.9 /100 | #184 | Fair 11.3% |
| Immigrants | Afghanistan | 33.3 /100 | #185 | Fair 11.4% |
| Immigrants | Sierra Leone | 32.9 /100 | #186 | Fair 11.4% |
Demographics Similar to Immigrants from England by Male Poverty
In terms of male poverty, the demographic groups most similar to Immigrants from England are Czechoslovakian (10.3%, a difference of 0.050%), Immigrants from Sweden (10.3%, a difference of 0.11%), Immigrants from Eastern Asia (10.4%, a difference of 0.13%), Northern European (10.4%, a difference of 0.17%), and Egyptian (10.3%, a difference of 0.23%).
| Demographics | Rating | Rank | Male Poverty |
| Irish | 96.8 /100 | #78 | Exceptional 10.3% |
| Immigrants | North America | 96.5 /100 | #79 | Exceptional 10.3% |
| English | 96.4 /100 | #80 | Exceptional 10.3% |
| Belgians | 95.9 /100 | #81 | Exceptional 10.3% |
| Egyptians | 95.9 /100 | #82 | Exceptional 10.3% |
| Immigrants | Sweden | 95.7 /100 | #83 | Exceptional 10.3% |
| Czechoslovakians | 95.6 /100 | #84 | Exceptional 10.3% |
| Immigrants | England | 95.5 /100 | #85 | Exceptional 10.4% |
| Immigrants | Eastern Asia | 95.3 /100 | #86 | Exceptional 10.4% |
| Northern Europeans | 95.2 /100 | #87 | Exceptional 10.4% |
| Cambodians | 95.0 /100 | #88 | Exceptional 10.4% |
| Immigrants | Denmark | 95.0 /100 | #89 | Exceptional 10.4% |
| Indians (Asian) | 94.9 /100 | #90 | Exceptional 10.4% |
| British | 94.8 /100 | #91 | Exceptional 10.4% |
| Jordanians | 94.4 /100 | #92 | Exceptional 10.4% |