Immigrants from Western Europe vs Immigrants from Lebanon Male Poverty
COMPARE
Immigrants from Western Europe
Immigrants from Lebanon
Male Poverty
Male Poverty Comparison
Immigrants from Western Europe
Immigrants from Lebanon
10.7%
MALE POVERTY
84.2/ 100
METRIC RATING
128th/ 347
METRIC RANK
11.7%
MALE POVERTY
13.6/ 100
METRIC RATING
200th/ 347
METRIC RANK
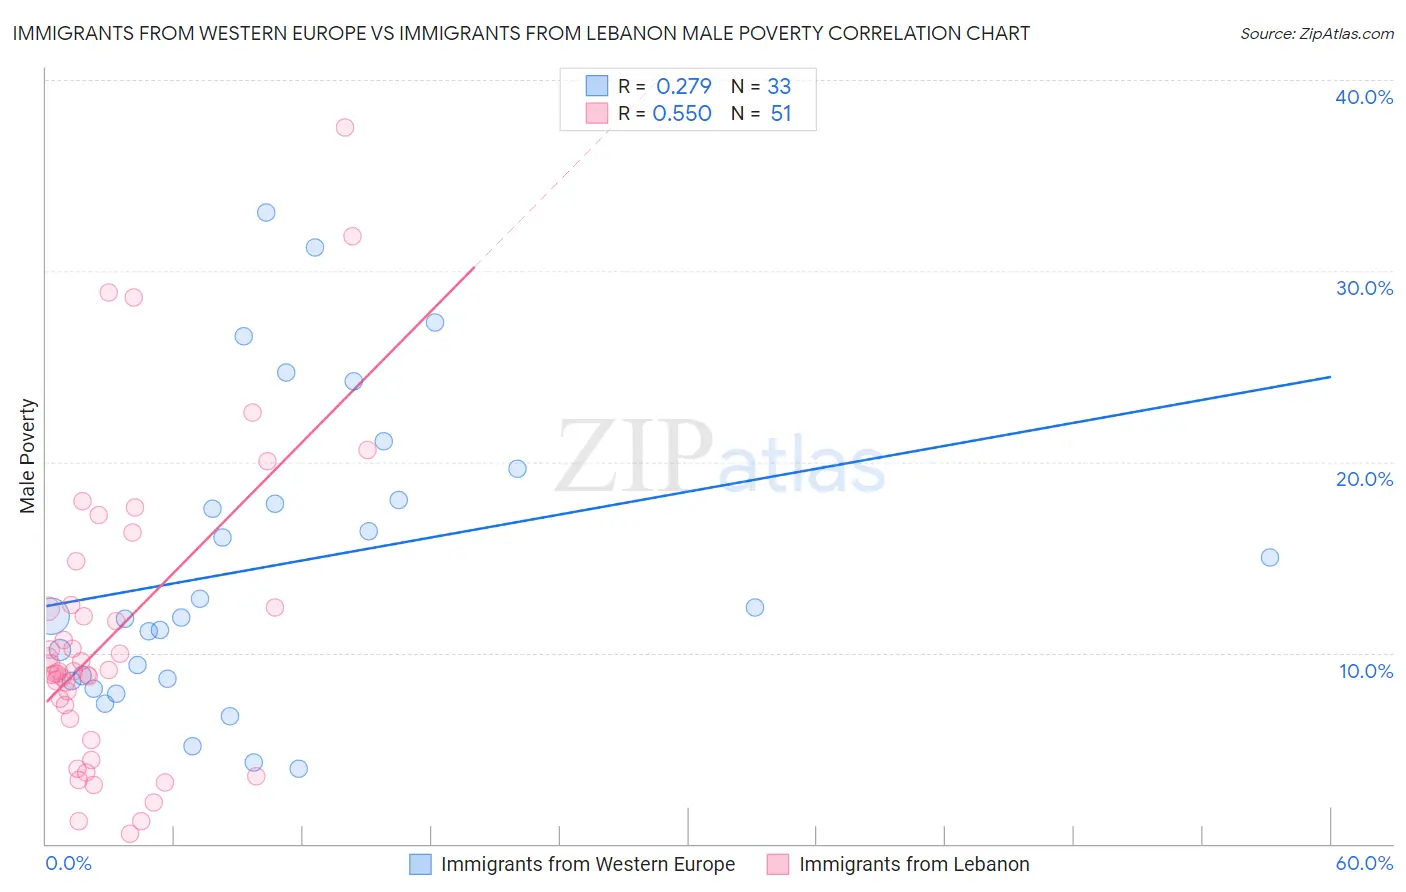
Immigrants from Western Europe vs Immigrants from Lebanon Male Poverty Correlation Chart
The statistical analysis conducted on geographies consisting of 493,468,603 people shows a weak positive correlation between the proportion of Immigrants from Western Europe and poverty level among males in the United States with a correlation coefficient (R) of 0.279 and weighted average of 10.7%. Similarly, the statistical analysis conducted on geographies consisting of 217,104,675 people shows a substantial positive correlation between the proportion of Immigrants from Lebanon and poverty level among males in the United States with a correlation coefficient (R) of 0.550 and weighted average of 11.7%, a difference of 9.0%.
Male Poverty Correlation Summary
| Measurement | Immigrants from Western Europe | Immigrants from Lebanon |
| Minimum | 3.9% | 0.52% |
| Maximum | 33.1% | 37.5% |
| Range | 29.2% | 37.0% |
| Mean | 14.6% | 11.1% |
| Median | 11.9% | 9.1% |
| Interquartile 25% (IQ1) | 8.6% | 6.6% |
| Interquartile 75% (IQ3) | 18.8% | 12.5% |
| Interquartile Range (IQR) | 10.2% | 5.9% |
| Standard Deviation (Sample) | 7.8% | 8.0% |
| Standard Deviation (Population) | 7.7% | 7.9% |
Similar Demographics by Male Poverty
Demographics Similar to Immigrants from Western Europe by Male Poverty
In terms of male poverty, the demographic groups most similar to Immigrants from Western Europe are Immigrants from Peru (10.7%, a difference of 0.010%), Immigrants from Ukraine (10.7%, a difference of 0.020%), Puget Sound Salish (10.7%, a difference of 0.020%), Chilean (10.7%, a difference of 0.060%), and Immigrants from Belarus (10.7%, a difference of 0.17%).
| Demographics | Rating | Rank | Male Poverty |
| Peruvians | 87.1 /100 | #121 | Excellent 10.7% |
| Native Hawaiians | 87.0 /100 | #122 | Excellent 10.7% |
| South Africans | 86.8 /100 | #123 | Excellent 10.7% |
| French | 86.7 /100 | #124 | Excellent 10.7% |
| Immigrants | Norway | 86.0 /100 | #125 | Excellent 10.7% |
| Immigrants | Ukraine | 84.3 /100 | #126 | Excellent 10.7% |
| Puget Sound Salish | 84.3 /100 | #127 | Excellent 10.7% |
| Immigrants | Western Europe | 84.2 /100 | #128 | Excellent 10.7% |
| Immigrants | Peru | 84.1 /100 | #129 | Excellent 10.7% |
| Chileans | 83.9 /100 | #130 | Excellent 10.7% |
| Immigrants | Belarus | 83.3 /100 | #131 | Excellent 10.7% |
| Immigrants | Vietnam | 83.0 /100 | #132 | Excellent 10.8% |
| Pakistanis | 83.0 /100 | #133 | Excellent 10.8% |
| New Zealanders | 82.9 /100 | #134 | Excellent 10.8% |
| Brazilians | 82.7 /100 | #135 | Excellent 10.8% |
Demographics Similar to Immigrants from Lebanon by Male Poverty
In terms of male poverty, the demographic groups most similar to Immigrants from Lebanon are Spaniard (11.7%, a difference of 0.010%), Spanish (11.7%, a difference of 0.10%), Iraqi (11.7%, a difference of 0.21%), Delaware (11.7%, a difference of 0.35%), and Hmong (11.6%, a difference of 0.41%).
| Demographics | Rating | Rank | Male Poverty |
| Immigrants | Kuwait | 17.3 /100 | #193 | Poor 11.6% |
| Immigrants | Kenya | 16.1 /100 | #194 | Poor 11.6% |
| Arabs | 15.8 /100 | #195 | Poor 11.6% |
| Hmong | 15.8 /100 | #196 | Poor 11.6% |
| Delaware | 15.4 /100 | #197 | Poor 11.7% |
| Iraqis | 14.7 /100 | #198 | Poor 11.7% |
| Spanish | 14.1 /100 | #199 | Poor 11.7% |
| Immigrants | Lebanon | 13.6 /100 | #200 | Poor 11.7% |
| Spaniards | 13.5 /100 | #201 | Poor 11.7% |
| Aleuts | 10.4 /100 | #202 | Poor 11.8% |
| Immigrants | Western Asia | 9.8 /100 | #203 | Tragic 11.8% |
| Immigrants | Uganda | 8.5 /100 | #204 | Tragic 11.8% |
| Panamanians | 6.2 /100 | #205 | Tragic 11.9% |
| Immigrants | Eastern Africa | 5.4 /100 | #206 | Tragic 12.0% |
| Malaysians | 5.2 /100 | #207 | Tragic 12.0% |