Immigrants from Western Asia vs Immigrants from Romania Single Father Poverty
COMPARE
Immigrants from Western Asia
Immigrants from Romania
Single Father Poverty
Single Father Poverty Comparison
Immigrants from Western Asia
Immigrants from Romania
16.0%
SINGLE FATHER POVERTY
80.7/ 100
METRIC RATING
145th/ 347
METRIC RANK
15.5%
SINGLE FATHER POVERTY
98.6/ 100
METRIC RATING
91st/ 347
METRIC RANK
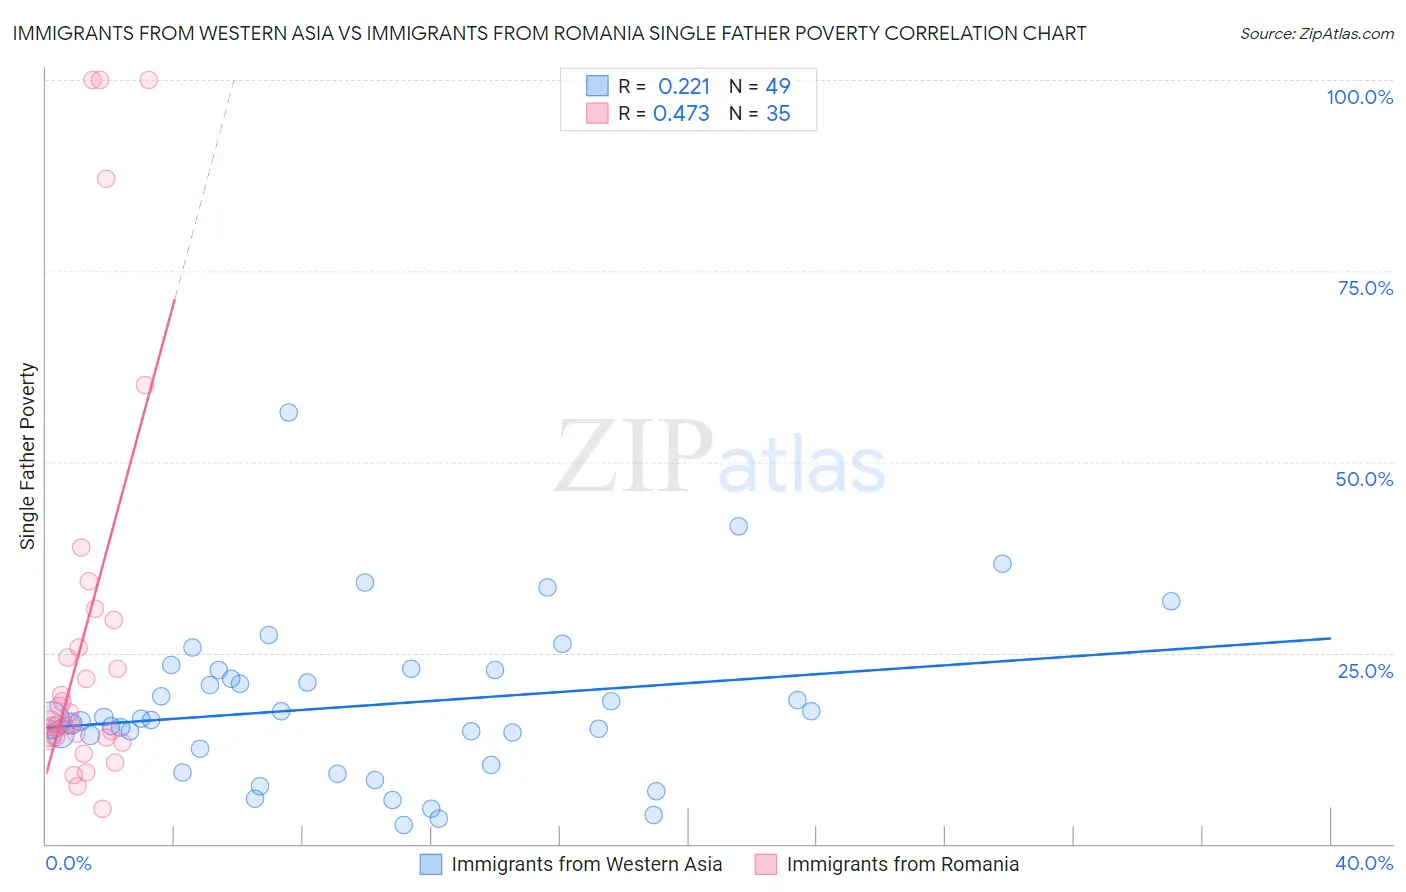
Immigrants from Western Asia vs Immigrants from Romania Single Father Poverty Correlation Chart
The statistical analysis conducted on geographies consisting of 315,849,822 people shows a weak positive correlation between the proportion of Immigrants from Western Asia and poverty level among single fathers in the United States with a correlation coefficient (R) of 0.221 and weighted average of 16.0%. Similarly, the statistical analysis conducted on geographies consisting of 209,903,487 people shows a moderate positive correlation between the proportion of Immigrants from Romania and poverty level among single fathers in the United States with a correlation coefficient (R) of 0.473 and weighted average of 15.5%, a difference of 3.3%.
Single Father Poverty Correlation Summary
| Measurement | Immigrants from Western Asia | Immigrants from Romania |
| Minimum | 2.4% | 4.5% |
| Maximum | 56.5% | 100.0% |
| Range | 54.1% | 95.5% |
| Mean | 18.1% | 27.9% |
| Median | 16.3% | 16.0% |
| Interquartile 25% (IQ1) | 11.4% | 13.9% |
| Interquartile 75% (IQ3) | 22.7% | 29.3% |
| Interquartile Range (IQR) | 11.3% | 15.3% |
| Standard Deviation (Sample) | 10.5% | 27.1% |
| Standard Deviation (Population) | 10.3% | 26.8% |
Similar Demographics by Single Father Poverty
Demographics Similar to Immigrants from Western Asia by Single Father Poverty
In terms of single father poverty, the demographic groups most similar to Immigrants from Western Asia are Immigrants from Kuwait (16.0%, a difference of 0.050%), Immigrants from Hungary (16.1%, a difference of 0.16%), Immigrants from Central America (16.0%, a difference of 0.18%), Liberian (16.0%, a difference of 0.20%), and Immigrants from Mexico (16.0%, a difference of 0.20%).
| Demographics | Rating | Rank | Single Father Poverty |
| Central Americans | 87.1 /100 | #138 | Excellent 16.0% |
| South Americans | 85.9 /100 | #139 | Excellent 16.0% |
| Immigrants | Netherlands | 85.3 /100 | #140 | Excellent 16.0% |
| Liberians | 83.3 /100 | #141 | Excellent 16.0% |
| Immigrants | Mexico | 83.3 /100 | #142 | Excellent 16.0% |
| Immigrants | Central America | 83.1 /100 | #143 | Excellent 16.0% |
| Immigrants | Kuwait | 81.4 /100 | #144 | Excellent 16.0% |
| Immigrants | Western Asia | 80.7 /100 | #145 | Excellent 16.0% |
| Immigrants | Hungary | 78.3 /100 | #146 | Good 16.1% |
| Colombians | 77.1 /100 | #147 | Good 16.1% |
| Nigerians | 76.8 /100 | #148 | Good 16.1% |
| South Africans | 75.1 /100 | #149 | Good 16.1% |
| Jordanians | 74.2 /100 | #150 | Good 16.1% |
| Immigrants | France | 73.1 /100 | #151 | Good 16.1% |
| Immigrants | Zimbabwe | 72.1 /100 | #152 | Good 16.1% |
Demographics Similar to Immigrants from Romania by Single Father Poverty
In terms of single father poverty, the demographic groups most similar to Immigrants from Romania are Mexican American Indian (15.5%, a difference of 0.10%), Immigrants from Serbia (15.5%, a difference of 0.11%), Basque (15.5%, a difference of 0.15%), Immigrants from Uruguay (15.6%, a difference of 0.29%), and Immigrants from Korea (15.5%, a difference of 0.34%).
| Demographics | Rating | Rank | Single Father Poverty |
| Peruvians | 99.2 /100 | #84 | Exceptional 15.4% |
| Immigrants | Oceania | 99.1 /100 | #85 | Exceptional 15.4% |
| Immigrants | Russia | 99.0 /100 | #86 | Exceptional 15.5% |
| Brazilians | 99.0 /100 | #87 | Exceptional 15.5% |
| Burmese | 99.0 /100 | #88 | Exceptional 15.5% |
| Immigrants | Korea | 99.0 /100 | #89 | Exceptional 15.5% |
| Mexican American Indians | 98.7 /100 | #90 | Exceptional 15.5% |
| Immigrants | Romania | 98.6 /100 | #91 | Exceptional 15.5% |
| Immigrants | Serbia | 98.5 /100 | #92 | Exceptional 15.5% |
| Basques | 98.4 /100 | #93 | Exceptional 15.5% |
| Immigrants | Uruguay | 98.2 /100 | #94 | Exceptional 15.6% |
| Immigrants | Kazakhstan | 98.2 /100 | #95 | Exceptional 15.6% |
| Immigrants | Belgium | 98.1 /100 | #96 | Exceptional 15.6% |
| Yaqui | 98.1 /100 | #97 | Exceptional 15.6% |
| Zimbabweans | 98.1 /100 | #98 | Exceptional 15.6% |