Immigrants from West Indies vs Guyanese Single Male Poverty
COMPARE
Immigrants from West Indies
Guyanese
Single Male Poverty
Single Male Poverty Comparison
Immigrants from West Indies
Guyanese
12.9%
SINGLE MALE POVERTY
33.0/ 100
METRIC RATING
183rd/ 347
METRIC RANK
12.8%
SINGLE MALE POVERTY
52.0/ 100
METRIC RATING
170th/ 347
METRIC RANK
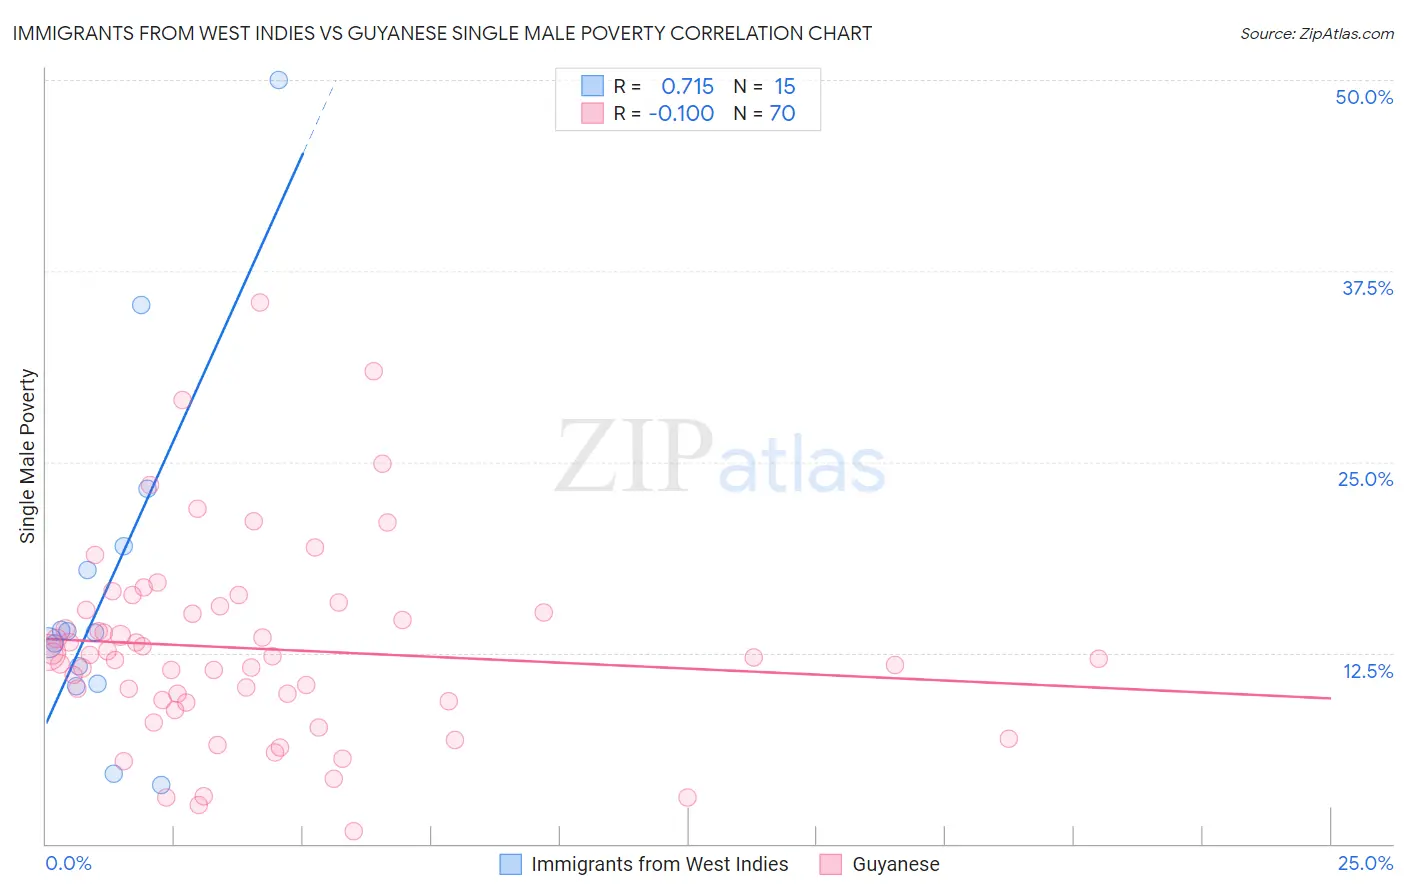
Immigrants from West Indies vs Guyanese Single Male Poverty Correlation Chart
The statistical analysis conducted on geographies consisting of 70,729,922 people shows a strong positive correlation between the proportion of Immigrants from West Indies and poverty level among single males in the United States with a correlation coefficient (R) of 0.715 and weighted average of 12.9%. Similarly, the statistical analysis conducted on geographies consisting of 165,156,840 people shows a poor negative correlation between the proportion of Guyanese and poverty level among single males in the United States with a correlation coefficient (R) of -0.100 and weighted average of 12.8%, a difference of 1.0%.
Single Male Poverty Correlation Summary
| Measurement | Immigrants from West Indies | Guyanese |
| Minimum | 3.8% | 0.85% |
| Maximum | 50.0% | 35.4% |
| Range | 46.2% | 34.6% |
| Mean | 17.0% | 12.8% |
| Median | 13.8% | 12.2% |
| Interquartile 25% (IQ1) | 10.5% | 9.3% |
| Interquartile 75% (IQ3) | 19.5% | 15.3% |
| Interquartile Range (IQR) | 9.0% | 5.9% |
| Standard Deviation (Sample) | 11.9% | 6.4% |
| Standard Deviation (Population) | 11.5% | 6.4% |
Demographics Similar to Immigrants from West Indies and Guyanese by Single Male Poverty
In terms of single male poverty, the demographic groups most similar to Immigrants from West Indies are Immigrants from Trinidad and Tobago (12.9%, a difference of 0.030%), Norwegian (12.9%, a difference of 0.060%), Nigerian (12.9%, a difference of 0.060%), Moroccan (12.9%, a difference of 0.22%), and Panamanian (12.9%, a difference of 0.26%). Similarly, the demographic groups most similar to Guyanese are South African (12.8%, a difference of 0.030%), Danish (12.8%, a difference of 0.030%), Immigrants from St. Vincent and the Grenadines (12.8%, a difference of 0.060%), Costa Rican (12.8%, a difference of 0.10%), and Puget Sound Salish (12.8%, a difference of 0.12%).
| Demographics | Rating | Rank | Single Male Poverty |
| Immigrants | Guyana | 60.5 /100 | #166 | Good 12.7% |
| Immigrants | Sudan | 58.2 /100 | #167 | Average 12.7% |
| Immigrants | Barbados | 57.7 /100 | #168 | Average 12.7% |
| Puget Sound Salish | 54.3 /100 | #169 | Average 12.8% |
| Guyanese | 52.0 /100 | #170 | Average 12.8% |
| South Africans | 51.5 /100 | #171 | Average 12.8% |
| Danes | 51.4 /100 | #172 | Average 12.8% |
| Immigrants | St. Vincent and the Grenadines | 50.9 /100 | #173 | Average 12.8% |
| Costa Ricans | 50.0 /100 | #174 | Average 12.8% |
| Croatians | 48.9 /100 | #175 | Average 12.8% |
| Syrians | 48.4 /100 | #176 | Average 12.8% |
| Immigrants | Canada | 44.8 /100 | #177 | Average 12.8% |
| Immigrants | Switzerland | 43.1 /100 | #178 | Average 12.8% |
| Israelis | 41.0 /100 | #179 | Average 12.9% |
| Immigrants | North America | 37.7 /100 | #180 | Fair 12.9% |
| Panamanians | 37.6 /100 | #181 | Fair 12.9% |
| Moroccans | 36.8 /100 | #182 | Fair 12.9% |
| Immigrants | West Indies | 33.0 /100 | #183 | Fair 12.9% |
| Immigrants | Trinidad and Tobago | 32.5 /100 | #184 | Fair 12.9% |
| Norwegians | 32.0 /100 | #185 | Fair 12.9% |
| Nigerians | 31.9 /100 | #186 | Fair 12.9% |