Immigrants from Vietnam vs Immigrants from Taiwan Seniors Poverty Over the Age of 65
COMPARE
Immigrants from Vietnam
Immigrants from Taiwan
Seniors Poverty Over the Age of 65
Seniors Poverty Over the Age of 65 Comparison
Immigrants from Vietnam
Immigrants from Taiwan
11.2%
SENIORS POVERTY OVER THE AGE OF 65
26.6/ 100
METRIC RATING
195th/ 347
METRIC RANK
9.7%
SENIORS POVERTY OVER THE AGE OF 65
99.5/ 100
METRIC RATING
46th/ 347
METRIC RANK
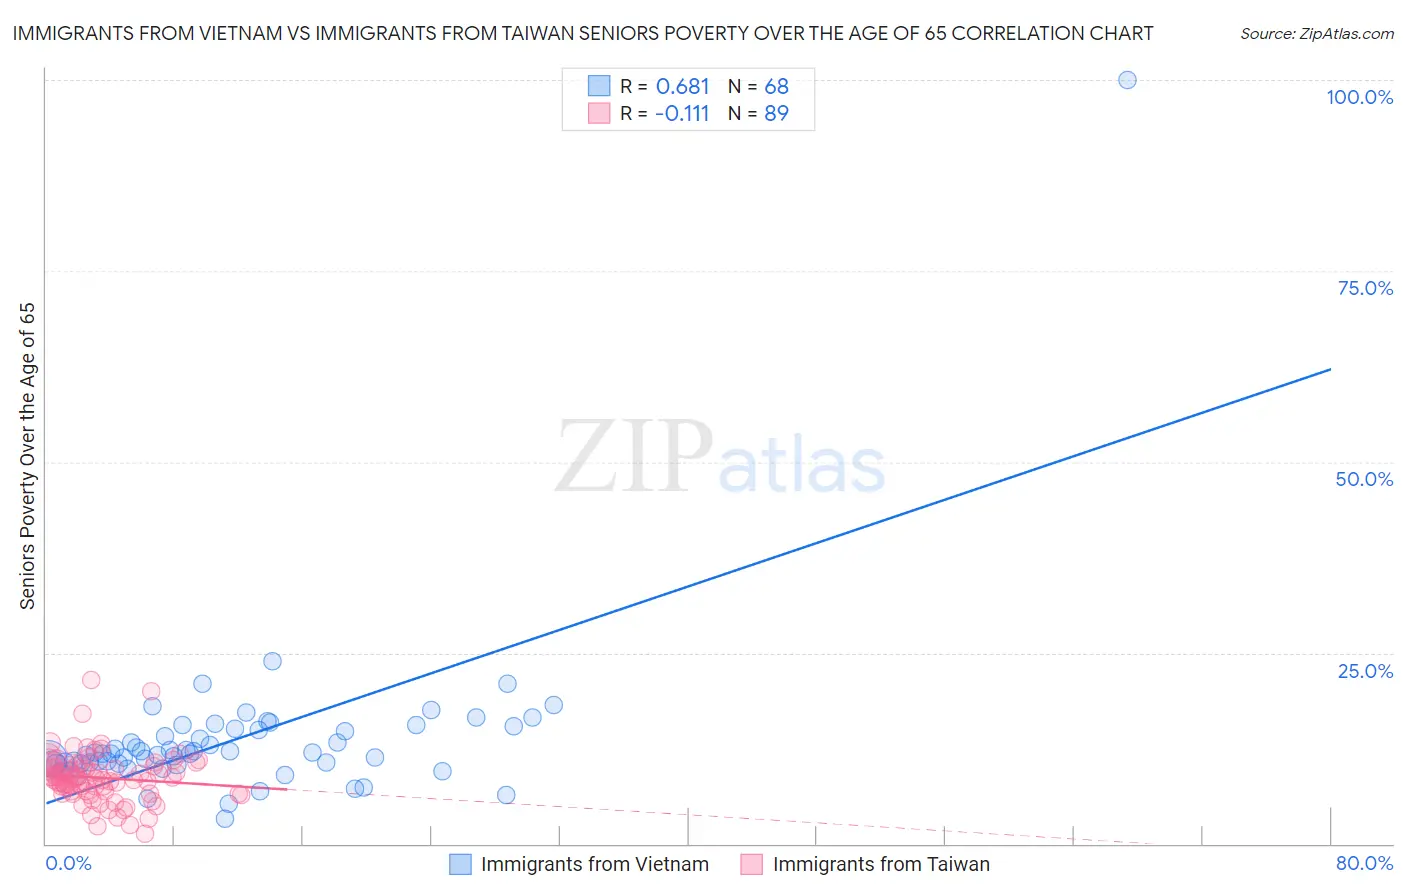
Immigrants from Vietnam vs Immigrants from Taiwan Seniors Poverty Over the Age of 65 Correlation Chart
The statistical analysis conducted on geographies consisting of 403,531,662 people shows a significant positive correlation between the proportion of Immigrants from Vietnam and poverty level among seniors over the age of 65 in the United States with a correlation coefficient (R) of 0.681 and weighted average of 11.2%. Similarly, the statistical analysis conducted on geographies consisting of 297,603,388 people shows a poor negative correlation between the proportion of Immigrants from Taiwan and poverty level among seniors over the age of 65 in the United States with a correlation coefficient (R) of -0.111 and weighted average of 9.7%, a difference of 15.8%.
Seniors Poverty Over the Age of 65 Correlation Summary
| Measurement | Immigrants from Vietnam | Immigrants from Taiwan |
| Minimum | 3.2% | 1.4% |
| Maximum | 100.0% | 21.4% |
| Range | 96.8% | 20.0% |
| Mean | 13.6% | 8.6% |
| Median | 11.7% | 8.4% |
| Interquartile 25% (IQ1) | 10.4% | 6.9% |
| Interquartile 75% (IQ3) | 15.0% | 10.2% |
| Interquartile Range (IQR) | 4.6% | 3.3% |
| Standard Deviation (Sample) | 11.3% | 3.2% |
| Standard Deviation (Population) | 11.2% | 3.2% |
Similar Demographics by Seniors Poverty Over the Age of 65
Demographics Similar to Immigrants from Vietnam by Seniors Poverty Over the Age of 65
In terms of seniors poverty over the age of 65, the demographic groups most similar to Immigrants from Vietnam are Chilean (11.2%, a difference of 0.13%), Bangladeshi (11.2%, a difference of 0.16%), Albanian (11.2%, a difference of 0.26%), Taiwanese (11.2%, a difference of 0.29%), and Immigrants from Southern Europe (11.1%, a difference of 0.37%).
| Demographics | Rating | Rank | Seniors Poverty Over the Age of 65 |
| Immigrants | Hong Kong | 36.3 /100 | #188 | Fair 11.1% |
| Immigrants | Laos | 35.7 /100 | #189 | Fair 11.1% |
| Indians (Asian) | 34.2 /100 | #190 | Fair 11.1% |
| Immigrants | Uganda | 32.2 /100 | #191 | Fair 11.1% |
| Immigrants | Southern Europe | 30.1 /100 | #192 | Fair 11.1% |
| Taiwanese | 29.2 /100 | #193 | Fair 11.2% |
| Chileans | 27.8 /100 | #194 | Fair 11.2% |
| Immigrants | Vietnam | 26.6 /100 | #195 | Fair 11.2% |
| Bangladeshis | 25.2 /100 | #196 | Fair 11.2% |
| Albanians | 24.4 /100 | #197 | Fair 11.2% |
| Immigrants | Burma/Myanmar | 21.3 /100 | #198 | Fair 11.3% |
| Immigrants | Israel | 20.3 /100 | #199 | Fair 11.3% |
| Alsatians | 20.1 /100 | #200 | Fair 11.3% |
| Immigrants | Brazil | 17.8 /100 | #201 | Poor 11.3% |
| Costa Ricans | 17.0 /100 | #202 | Poor 11.3% |
Demographics Similar to Immigrants from Taiwan by Seniors Poverty Over the Age of 65
In terms of seniors poverty over the age of 65, the demographic groups most similar to Immigrants from Taiwan are Immigrants from South Central Asia (9.7%, a difference of 0.010%), French (9.7%, a difference of 0.12%), Estonian (9.6%, a difference of 0.14%), Immigrants from Lithuania (9.7%, a difference of 0.18%), and Austrian (9.6%, a difference of 0.32%).
| Demographics | Rating | Rank | Seniors Poverty Over the Age of 65 |
| Greeks | 99.6 /100 | #39 | Exceptional 9.6% |
| Assyrians/Chaldeans/Syriacs | 99.6 /100 | #40 | Exceptional 9.6% |
| Immigrants | North Macedonia | 99.6 /100 | #41 | Exceptional 9.6% |
| Zimbabweans | 99.6 /100 | #42 | Exceptional 9.6% |
| Eastern Europeans | 99.6 /100 | #43 | Exceptional 9.6% |
| Austrians | 99.5 /100 | #44 | Exceptional 9.6% |
| Estonians | 99.5 /100 | #45 | Exceptional 9.6% |
| Immigrants | Taiwan | 99.5 /100 | #46 | Exceptional 9.7% |
| Immigrants | South Central Asia | 99.5 /100 | #47 | Exceptional 9.7% |
| French | 99.5 /100 | #48 | Exceptional 9.7% |
| Immigrants | Lithuania | 99.4 /100 | #49 | Exceptional 9.7% |
| Hungarians | 99.4 /100 | #50 | Exceptional 9.7% |
| Carpatho Rusyns | 99.3 /100 | #51 | Exceptional 9.7% |
| Filipinos | 99.3 /100 | #52 | Exceptional 9.7% |
| Slavs | 99.2 /100 | #53 | Exceptional 9.8% |