Immigrants from Vietnam vs Albanian Seniors Poverty Over the Age of 65
COMPARE
Immigrants from Vietnam
Albanian
Seniors Poverty Over the Age of 65
Seniors Poverty Over the Age of 65 Comparison
Immigrants from Vietnam
Albanians
11.2%
SENIORS POVERTY OVER THE AGE OF 65
26.6/ 100
METRIC RATING
195th/ 347
METRIC RANK
11.2%
SENIORS POVERTY OVER THE AGE OF 65
24.4/ 100
METRIC RATING
197th/ 347
METRIC RANK
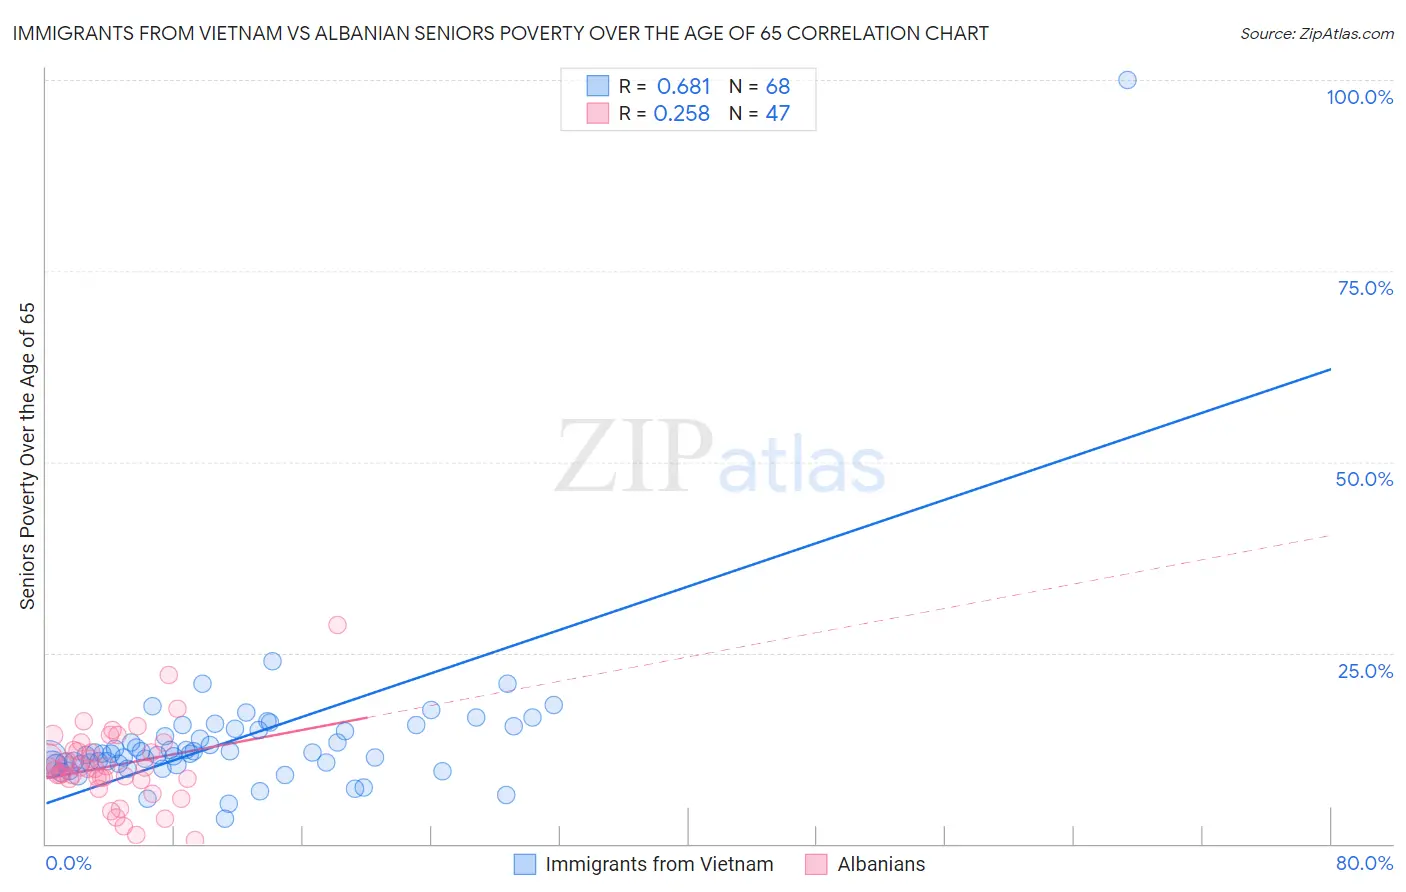
Immigrants from Vietnam vs Albanian Seniors Poverty Over the Age of 65 Correlation Chart
The statistical analysis conducted on geographies consisting of 403,531,662 people shows a significant positive correlation between the proportion of Immigrants from Vietnam and poverty level among seniors over the age of 65 in the United States with a correlation coefficient (R) of 0.681 and weighted average of 11.2%. Similarly, the statistical analysis conducted on geographies consisting of 192,842,958 people shows a weak positive correlation between the proportion of Albanians and poverty level among seniors over the age of 65 in the United States with a correlation coefficient (R) of 0.258 and weighted average of 11.2%, a difference of 0.26%.
Seniors Poverty Over the Age of 65 Correlation Summary
| Measurement | Immigrants from Vietnam | Albanian |
| Minimum | 3.2% | 0.44% |
| Maximum | 100.0% | 28.7% |
| Range | 96.8% | 28.2% |
| Mean | 13.6% | 10.2% |
| Median | 11.7% | 9.8% |
| Interquartile 25% (IQ1) | 10.4% | 8.4% |
| Interquartile 75% (IQ3) | 15.0% | 12.3% |
| Interquartile Range (IQR) | 4.6% | 3.8% |
| Standard Deviation (Sample) | 11.3% | 5.0% |
| Standard Deviation (Population) | 11.2% | 5.0% |
Demographics Similar to Immigrants from Vietnam and Albanians by Seniors Poverty Over the Age of 65
In terms of seniors poverty over the age of 65, the demographic groups most similar to Immigrants from Vietnam are Chilean (11.2%, a difference of 0.13%), Bangladeshi (11.2%, a difference of 0.16%), Taiwanese (11.2%, a difference of 0.29%), Immigrants from Southern Europe (11.1%, a difference of 0.37%), and Immigrants from Uganda (11.1%, a difference of 0.59%). Similarly, the demographic groups most similar to Albanians are Bangladeshi (11.2%, a difference of 0.090%), Immigrants from Burma/Myanmar (11.3%, a difference of 0.38%), Chilean (11.2%, a difference of 0.39%), Immigrants from Israel (11.3%, a difference of 0.52%), and Taiwanese (11.2%, a difference of 0.54%).
| Demographics | Rating | Rank | Seniors Poverty Over the Age of 65 |
| Immigrants | Eastern Asia | 37.5 /100 | #186 | Fair 11.1% |
| Immigrants | Middle Africa | 37.4 /100 | #187 | Fair 11.1% |
| Immigrants | Hong Kong | 36.3 /100 | #188 | Fair 11.1% |
| Immigrants | Laos | 35.7 /100 | #189 | Fair 11.1% |
| Indians (Asian) | 34.2 /100 | #190 | Fair 11.1% |
| Immigrants | Uganda | 32.2 /100 | #191 | Fair 11.1% |
| Immigrants | Southern Europe | 30.1 /100 | #192 | Fair 11.1% |
| Taiwanese | 29.2 /100 | #193 | Fair 11.2% |
| Chileans | 27.8 /100 | #194 | Fair 11.2% |
| Immigrants | Vietnam | 26.6 /100 | #195 | Fair 11.2% |
| Bangladeshis | 25.2 /100 | #196 | Fair 11.2% |
| Albanians | 24.4 /100 | #197 | Fair 11.2% |
| Immigrants | Burma/Myanmar | 21.3 /100 | #198 | Fair 11.3% |
| Immigrants | Israel | 20.3 /100 | #199 | Fair 11.3% |
| Alsatians | 20.1 /100 | #200 | Fair 11.3% |
| Immigrants | Brazil | 17.8 /100 | #201 | Poor 11.3% |
| Costa Ricans | 17.0 /100 | #202 | Poor 11.3% |
| Immigrants | Zaire | 16.9 /100 | #203 | Poor 11.3% |
| Israelis | 16.5 /100 | #204 | Poor 11.3% |
| Brazilians | 15.4 /100 | #205 | Poor 11.3% |
| Choctaw | 14.5 /100 | #206 | Poor 11.4% |