Immigrants from Vietnam vs Pakistani Seniors Poverty Over the Age of 65
COMPARE
Immigrants from Vietnam
Pakistani
Seniors Poverty Over the Age of 65
Seniors Poverty Over the Age of 65 Comparison
Immigrants from Vietnam
Pakistanis
11.2%
SENIORS POVERTY OVER THE AGE OF 65
26.6/ 100
METRIC RATING
195th/ 347
METRIC RANK
10.3%
SENIORS POVERTY OVER THE AGE OF 65
92.2/ 100
METRIC RATING
116th/ 347
METRIC RANK
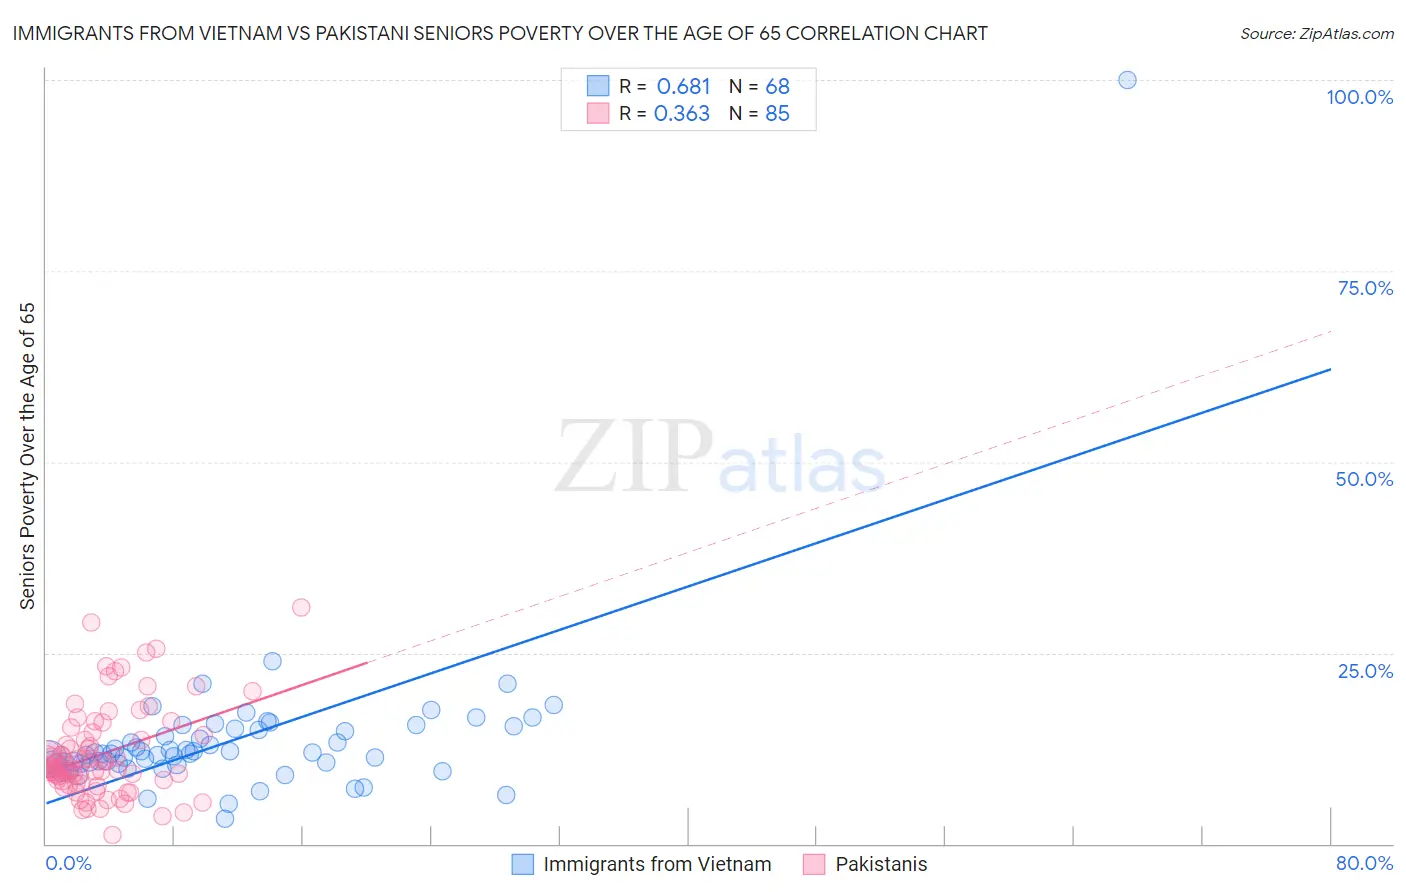
Immigrants from Vietnam vs Pakistani Seniors Poverty Over the Age of 65 Correlation Chart
The statistical analysis conducted on geographies consisting of 403,531,662 people shows a significant positive correlation between the proportion of Immigrants from Vietnam and poverty level among seniors over the age of 65 in the United States with a correlation coefficient (R) of 0.681 and weighted average of 11.2%. Similarly, the statistical analysis conducted on geographies consisting of 334,315,212 people shows a mild positive correlation between the proportion of Pakistanis and poverty level among seniors over the age of 65 in the United States with a correlation coefficient (R) of 0.363 and weighted average of 10.3%, a difference of 8.2%.
Seniors Poverty Over the Age of 65 Correlation Summary
| Measurement | Immigrants from Vietnam | Pakistani |
| Minimum | 3.2% | 1.2% |
| Maximum | 100.0% | 30.9% |
| Range | 96.8% | 29.7% |
| Mean | 13.6% | 11.8% |
| Median | 11.7% | 10.0% |
| Interquartile 25% (IQ1) | 10.4% | 8.0% |
| Interquartile 75% (IQ3) | 15.0% | 14.4% |
| Interquartile Range (IQR) | 4.6% | 6.4% |
| Standard Deviation (Sample) | 11.3% | 5.9% |
| Standard Deviation (Population) | 11.2% | 5.9% |
Similar Demographics by Seniors Poverty Over the Age of 65
Demographics Similar to Immigrants from Vietnam by Seniors Poverty Over the Age of 65
In terms of seniors poverty over the age of 65, the demographic groups most similar to Immigrants from Vietnam are Chilean (11.2%, a difference of 0.13%), Bangladeshi (11.2%, a difference of 0.16%), Albanian (11.2%, a difference of 0.26%), Taiwanese (11.2%, a difference of 0.29%), and Immigrants from Southern Europe (11.1%, a difference of 0.37%).
| Demographics | Rating | Rank | Seniors Poverty Over the Age of 65 |
| Immigrants | Hong Kong | 36.3 /100 | #188 | Fair 11.1% |
| Immigrants | Laos | 35.7 /100 | #189 | Fair 11.1% |
| Indians (Asian) | 34.2 /100 | #190 | Fair 11.1% |
| Immigrants | Uganda | 32.2 /100 | #191 | Fair 11.1% |
| Immigrants | Southern Europe | 30.1 /100 | #192 | Fair 11.1% |
| Taiwanese | 29.2 /100 | #193 | Fair 11.2% |
| Chileans | 27.8 /100 | #194 | Fair 11.2% |
| Immigrants | Vietnam | 26.6 /100 | #195 | Fair 11.2% |
| Bangladeshis | 25.2 /100 | #196 | Fair 11.2% |
| Albanians | 24.4 /100 | #197 | Fair 11.2% |
| Immigrants | Burma/Myanmar | 21.3 /100 | #198 | Fair 11.3% |
| Immigrants | Israel | 20.3 /100 | #199 | Fair 11.3% |
| Alsatians | 20.1 /100 | #200 | Fair 11.3% |
| Immigrants | Brazil | 17.8 /100 | #201 | Poor 11.3% |
| Costa Ricans | 17.0 /100 | #202 | Poor 11.3% |
Demographics Similar to Pakistanis by Seniors Poverty Over the Age of 65
In terms of seniors poverty over the age of 65, the demographic groups most similar to Pakistanis are Lebanese (10.3%, a difference of 0.060%), Okinawan (10.4%, a difference of 0.14%), Immigrants from Italy (10.3%, a difference of 0.15%), Immigrants from Denmark (10.3%, a difference of 0.19%), and Immigrants from Western Europe (10.4%, a difference of 0.33%).
| Demographics | Rating | Rank | Seniors Poverty Over the Age of 65 |
| Syrians | 93.8 /100 | #109 | Exceptional 10.3% |
| Immigrants | Zimbabwe | 93.5 /100 | #110 | Exceptional 10.3% |
| Immigrants | Belgium | 93.4 /100 | #111 | Exceptional 10.3% |
| Immigrants | Korea | 93.3 /100 | #112 | Exceptional 10.3% |
| Immigrants | Romania | 93.3 /100 | #113 | Exceptional 10.3% |
| Immigrants | Denmark | 92.7 /100 | #114 | Exceptional 10.3% |
| Immigrants | Italy | 92.6 /100 | #115 | Exceptional 10.3% |
| Pakistanis | 92.2 /100 | #116 | Exceptional 10.3% |
| Lebanese | 92.0 /100 | #117 | Exceptional 10.3% |
| Okinawans | 91.7 /100 | #118 | Exceptional 10.4% |
| Immigrants | Western Europe | 91.1 /100 | #119 | Exceptional 10.4% |
| Immigrants | Bosnia and Herzegovina | 90.8 /100 | #120 | Exceptional 10.4% |
| Immigrants | Iraq | 90.7 /100 | #121 | Exceptional 10.4% |
| Immigrants | Moldova | 90.7 /100 | #122 | Exceptional 10.4% |
| Hmong | 90.0 /100 | #123 | Exceptional 10.4% |