Immigrants from Belgium vs Immigrants from Taiwan Seniors Poverty Over the Age of 65
COMPARE
Immigrants from Belgium
Immigrants from Taiwan
Seniors Poverty Over the Age of 65
Seniors Poverty Over the Age of 65 Comparison
Immigrants from Belgium
Immigrants from Taiwan
10.3%
SENIORS POVERTY OVER THE AGE OF 65
93.4/ 100
METRIC RATING
111th/ 347
METRIC RANK
9.7%
SENIORS POVERTY OVER THE AGE OF 65
99.5/ 100
METRIC RATING
46th/ 347
METRIC RANK
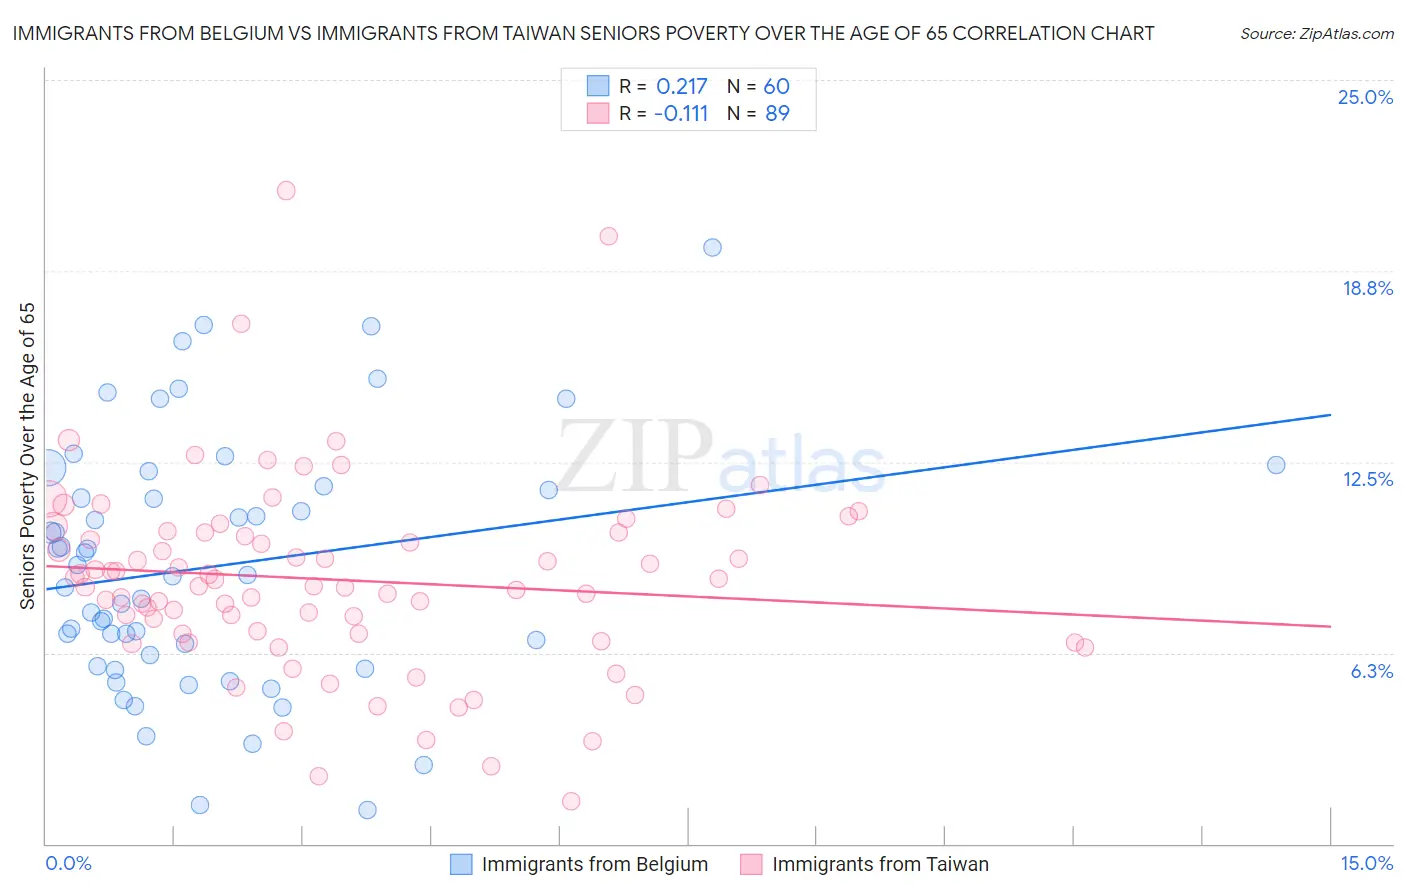
Immigrants from Belgium vs Immigrants from Taiwan Seniors Poverty Over the Age of 65 Correlation Chart
The statistical analysis conducted on geographies consisting of 146,577,251 people shows a weak positive correlation between the proportion of Immigrants from Belgium and poverty level among seniors over the age of 65 in the United States with a correlation coefficient (R) of 0.217 and weighted average of 10.3%. Similarly, the statistical analysis conducted on geographies consisting of 297,603,388 people shows a poor negative correlation between the proportion of Immigrants from Taiwan and poverty level among seniors over the age of 65 in the United States with a correlation coefficient (R) of -0.111 and weighted average of 9.7%, a difference of 6.5%.
Seniors Poverty Over the Age of 65 Correlation Summary
| Measurement | Immigrants from Belgium | Immigrants from Taiwan |
| Minimum | 1.1% | 1.4% |
| Maximum | 19.5% | 21.4% |
| Range | 18.4% | 20.0% |
| Mean | 9.1% | 8.6% |
| Median | 8.8% | 8.4% |
| Interquartile 25% (IQ1) | 6.0% | 6.9% |
| Interquartile 75% (IQ3) | 11.6% | 10.2% |
| Interquartile Range (IQR) | 5.7% | 3.3% |
| Standard Deviation (Sample) | 4.1% | 3.2% |
| Standard Deviation (Population) | 4.1% | 3.2% |
Similar Demographics by Seniors Poverty Over the Age of 65
Demographics Similar to Immigrants from Belgium by Seniors Poverty Over the Age of 65
In terms of seniors poverty over the age of 65, the demographic groups most similar to Immigrants from Belgium are Immigrants from Korea (10.3%, a difference of 0.020%), Immigrants from Zimbabwe (10.3%, a difference of 0.030%), Immigrants from Romania (10.3%, a difference of 0.060%), Syrian (10.3%, a difference of 0.17%), and Hawaiian (10.3%, a difference of 0.20%).
| Demographics | Rating | Rank | Seniors Poverty Over the Age of 65 |
| South Africans | 94.3 /100 | #104 | Exceptional 10.3% |
| Aleuts | 94.1 /100 | #105 | Exceptional 10.3% |
| Kenyans | 94.1 /100 | #106 | Exceptional 10.3% |
| Hawaiians | 93.9 /100 | #107 | Exceptional 10.3% |
| Immigrants | Croatia | 93.9 /100 | #108 | Exceptional 10.3% |
| Syrians | 93.8 /100 | #109 | Exceptional 10.3% |
| Immigrants | Zimbabwe | 93.5 /100 | #110 | Exceptional 10.3% |
| Immigrants | Belgium | 93.4 /100 | #111 | Exceptional 10.3% |
| Immigrants | Korea | 93.3 /100 | #112 | Exceptional 10.3% |
| Immigrants | Romania | 93.3 /100 | #113 | Exceptional 10.3% |
| Immigrants | Denmark | 92.7 /100 | #114 | Exceptional 10.3% |
| Immigrants | Italy | 92.6 /100 | #115 | Exceptional 10.3% |
| Pakistanis | 92.2 /100 | #116 | Exceptional 10.3% |
| Lebanese | 92.0 /100 | #117 | Exceptional 10.3% |
| Okinawans | 91.7 /100 | #118 | Exceptional 10.4% |
Demographics Similar to Immigrants from Taiwan by Seniors Poverty Over the Age of 65
In terms of seniors poverty over the age of 65, the demographic groups most similar to Immigrants from Taiwan are Immigrants from South Central Asia (9.7%, a difference of 0.010%), French (9.7%, a difference of 0.12%), Estonian (9.6%, a difference of 0.14%), Immigrants from Lithuania (9.7%, a difference of 0.18%), and Austrian (9.6%, a difference of 0.32%).
| Demographics | Rating | Rank | Seniors Poverty Over the Age of 65 |
| Greeks | 99.6 /100 | #39 | Exceptional 9.6% |
| Assyrians/Chaldeans/Syriacs | 99.6 /100 | #40 | Exceptional 9.6% |
| Immigrants | North Macedonia | 99.6 /100 | #41 | Exceptional 9.6% |
| Zimbabweans | 99.6 /100 | #42 | Exceptional 9.6% |
| Eastern Europeans | 99.6 /100 | #43 | Exceptional 9.6% |
| Austrians | 99.5 /100 | #44 | Exceptional 9.6% |
| Estonians | 99.5 /100 | #45 | Exceptional 9.6% |
| Immigrants | Taiwan | 99.5 /100 | #46 | Exceptional 9.7% |
| Immigrants | South Central Asia | 99.5 /100 | #47 | Exceptional 9.7% |
| French | 99.5 /100 | #48 | Exceptional 9.7% |
| Immigrants | Lithuania | 99.4 /100 | #49 | Exceptional 9.7% |
| Hungarians | 99.4 /100 | #50 | Exceptional 9.7% |
| Carpatho Rusyns | 99.3 /100 | #51 | Exceptional 9.7% |
| Filipinos | 99.3 /100 | #52 | Exceptional 9.7% |
| Slavs | 99.2 /100 | #53 | Exceptional 9.8% |