Immigrants from Vietnam vs Immigrants from Ethiopia Seniors Poverty Over the Age of 65
COMPARE
Immigrants from Vietnam
Immigrants from Ethiopia
Seniors Poverty Over the Age of 65
Seniors Poverty Over the Age of 65 Comparison
Immigrants from Vietnam
Immigrants from Ethiopia
11.2%
SENIORS POVERTY OVER THE AGE OF 65
26.6/ 100
METRIC RATING
195th/ 347
METRIC RANK
10.7%
SENIORS POVERTY OVER THE AGE OF 65
72.9/ 100
METRIC RATING
157th/ 347
METRIC RANK
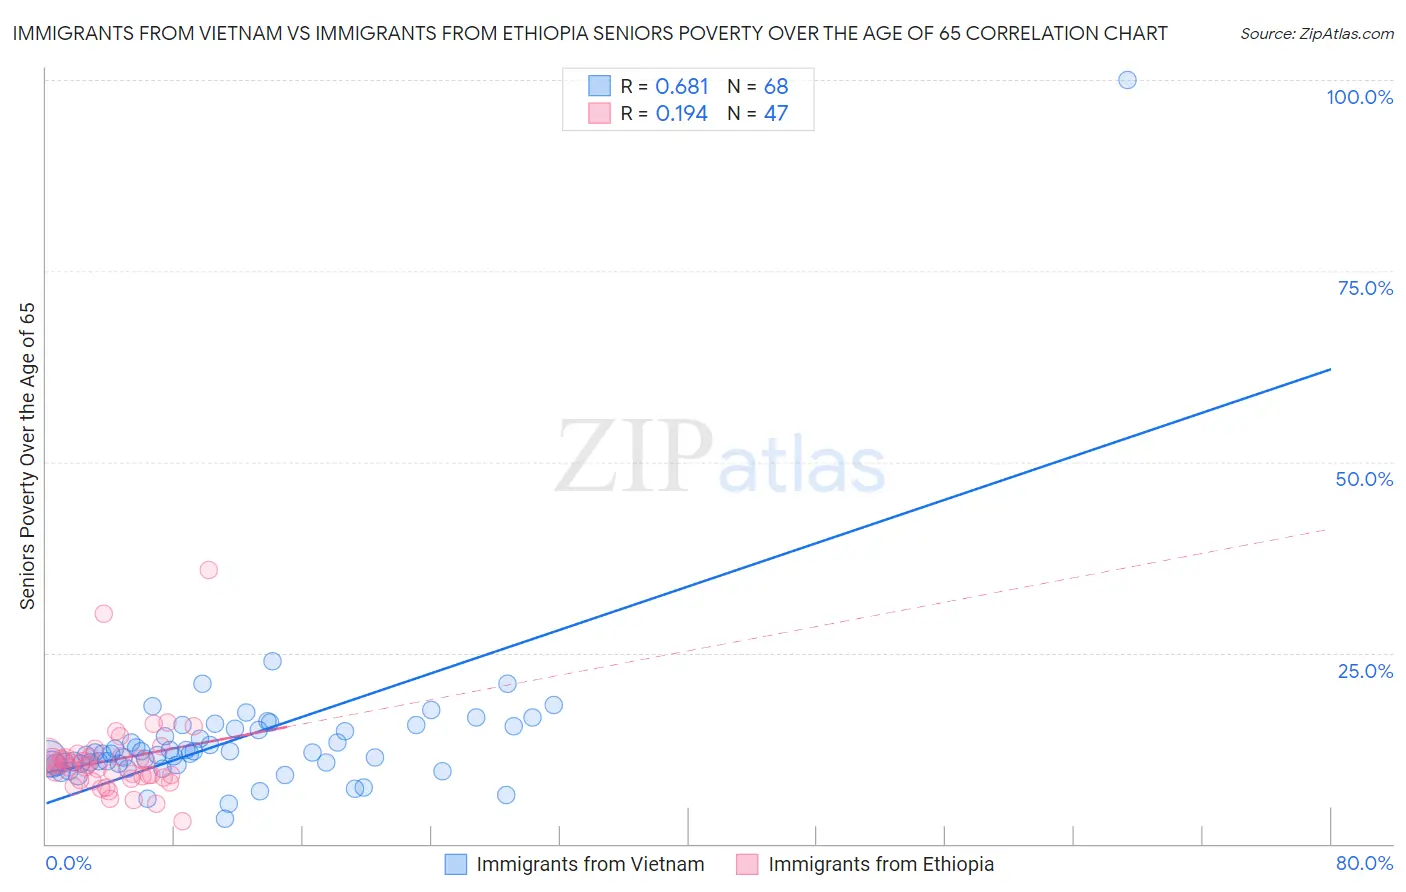
Immigrants from Vietnam vs Immigrants from Ethiopia Seniors Poverty Over the Age of 65 Correlation Chart
The statistical analysis conducted on geographies consisting of 403,531,662 people shows a significant positive correlation between the proportion of Immigrants from Vietnam and poverty level among seniors over the age of 65 in the United States with a correlation coefficient (R) of 0.681 and weighted average of 11.2%. Similarly, the statistical analysis conducted on geographies consisting of 211,218,607 people shows a poor positive correlation between the proportion of Immigrants from Ethiopia and poverty level among seniors over the age of 65 in the United States with a correlation coefficient (R) of 0.194 and weighted average of 10.7%, a difference of 4.5%.
Seniors Poverty Over the Age of 65 Correlation Summary
| Measurement | Immigrants from Vietnam | Immigrants from Ethiopia |
| Minimum | 3.2% | 2.9% |
| Maximum | 100.0% | 35.9% |
| Range | 96.8% | 32.9% |
| Mean | 13.6% | 11.0% |
| Median | 11.7% | 10.2% |
| Interquartile 25% (IQ1) | 10.4% | 8.4% |
| Interquartile 75% (IQ3) | 15.0% | 11.5% |
| Interquartile Range (IQR) | 4.6% | 3.0% |
| Standard Deviation (Sample) | 11.3% | 5.4% |
| Standard Deviation (Population) | 11.2% | 5.4% |
Similar Demographics by Seniors Poverty Over the Age of 65
Demographics Similar to Immigrants from Vietnam by Seniors Poverty Over the Age of 65
In terms of seniors poverty over the age of 65, the demographic groups most similar to Immigrants from Vietnam are Chilean (11.2%, a difference of 0.13%), Bangladeshi (11.2%, a difference of 0.16%), Albanian (11.2%, a difference of 0.26%), Taiwanese (11.2%, a difference of 0.29%), and Immigrants from Southern Europe (11.1%, a difference of 0.37%).
| Demographics | Rating | Rank | Seniors Poverty Over the Age of 65 |
| Immigrants | Hong Kong | 36.3 /100 | #188 | Fair 11.1% |
| Immigrants | Laos | 35.7 /100 | #189 | Fair 11.1% |
| Indians (Asian) | 34.2 /100 | #190 | Fair 11.1% |
| Immigrants | Uganda | 32.2 /100 | #191 | Fair 11.1% |
| Immigrants | Southern Europe | 30.1 /100 | #192 | Fair 11.1% |
| Taiwanese | 29.2 /100 | #193 | Fair 11.2% |
| Chileans | 27.8 /100 | #194 | Fair 11.2% |
| Immigrants | Vietnam | 26.6 /100 | #195 | Fair 11.2% |
| Bangladeshis | 25.2 /100 | #196 | Fair 11.2% |
| Albanians | 24.4 /100 | #197 | Fair 11.2% |
| Immigrants | Burma/Myanmar | 21.3 /100 | #198 | Fair 11.3% |
| Immigrants | Israel | 20.3 /100 | #199 | Fair 11.3% |
| Alsatians | 20.1 /100 | #200 | Fair 11.3% |
| Immigrants | Brazil | 17.8 /100 | #201 | Poor 11.3% |
| Costa Ricans | 17.0 /100 | #202 | Poor 11.3% |
Demographics Similar to Immigrants from Ethiopia by Seniors Poverty Over the Age of 65
In terms of seniors poverty over the age of 65, the demographic groups most similar to Immigrants from Ethiopia are Ethiopian (10.7%, a difference of 0.010%), Chickasaw (10.7%, a difference of 0.080%), Immigrants from Sierra Leone (10.7%, a difference of 0.14%), Immigrants from Saudi Arabia (10.7%, a difference of 0.24%), and Immigrants from Micronesia (10.7%, a difference of 0.24%).
| Demographics | Rating | Rank | Seniors Poverty Over the Age of 65 |
| Immigrants | Switzerland | 77.3 /100 | #150 | Good 10.6% |
| Spanish | 76.8 /100 | #151 | Good 10.6% |
| Immigrants | Egypt | 76.5 /100 | #152 | Good 10.6% |
| Fijians | 75.6 /100 | #153 | Good 10.7% |
| Immigrants | Saudi Arabia | 74.9 /100 | #154 | Good 10.7% |
| Chickasaw | 73.6 /100 | #155 | Good 10.7% |
| Ethiopians | 72.9 /100 | #156 | Good 10.7% |
| Immigrants | Ethiopia | 72.9 /100 | #157 | Good 10.7% |
| Immigrants | Sierra Leone | 71.7 /100 | #158 | Good 10.7% |
| Immigrants | Micronesia | 70.8 /100 | #159 | Good 10.7% |
| Sudanese | 68.2 /100 | #160 | Good 10.7% |
| Arabs | 65.2 /100 | #161 | Good 10.8% |
| Immigrants | Indonesia | 64.8 /100 | #162 | Good 10.8% |
| Tsimshian | 64.5 /100 | #163 | Good 10.8% |
| Potawatomi | 62.6 /100 | #164 | Good 10.8% |