Immigrants from Vietnam vs New Zealander Poverty
COMPARE
Immigrants from Vietnam
New Zealander
Poverty
Poverty Comparison
Immigrants from Vietnam
New Zealanders
11.8%
POVERTY
85.2/ 100
METRIC RATING
135th/ 347
METRIC RANK
11.7%
POVERTY
88.7/ 100
METRIC RATING
121st/ 347
METRIC RANK
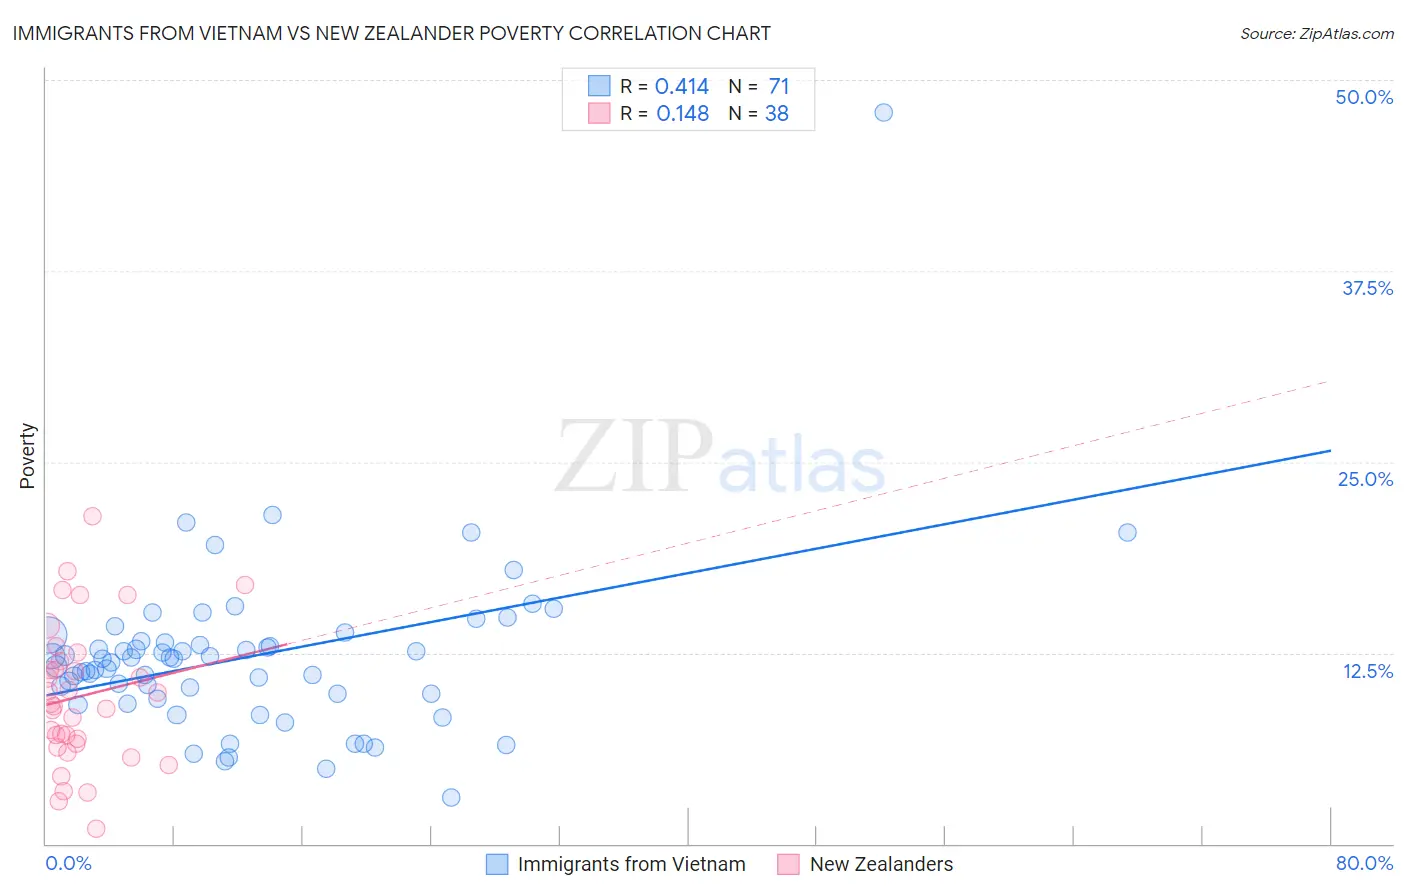
Immigrants from Vietnam vs New Zealander Poverty Correlation Chart
The statistical analysis conducted on geographies consisting of 404,593,024 people shows a moderate positive correlation between the proportion of Immigrants from Vietnam and poverty level in the United States with a correlation coefficient (R) of 0.414 and weighted average of 11.8%. Similarly, the statistical analysis conducted on geographies consisting of 106,895,719 people shows a poor positive correlation between the proportion of New Zealanders and poverty level in the United States with a correlation coefficient (R) of 0.148 and weighted average of 11.7%, a difference of 0.80%.
Poverty Correlation Summary
| Measurement | Immigrants from Vietnam | New Zealander |
| Minimum | 3.0% | 0.99% |
| Maximum | 47.9% | 21.4% |
| Range | 44.9% | 20.4% |
| Mean | 12.3% | 9.7% |
| Median | 12.1% | 9.1% |
| Interquartile 25% (IQ1) | 9.8% | 6.6% |
| Interquartile 75% (IQ3) | 13.2% | 12.0% |
| Interquartile Range (IQR) | 3.4% | 5.4% |
| Standard Deviation (Sample) | 5.7% | 4.6% |
| Standard Deviation (Population) | 5.7% | 4.6% |
Demographics Similar to Immigrants from Vietnam and New Zealanders by Poverty
In terms of poverty, the demographic groups most similar to Immigrants from Vietnam are Yugoslavian (11.8%, a difference of 0.010%), Immigrants from Western Europe (11.8%, a difference of 0.020%), Peruvian (11.8%, a difference of 0.090%), Chilean (11.8%, a difference of 0.19%), and French (11.8%, a difference of 0.20%). Similarly, the demographic groups most similar to New Zealanders are Puget Sound Salish (11.7%, a difference of 0.0%), Immigrants from Hungary (11.7%, a difference of 0.020%), Immigrants from South Eastern Asia (11.7%, a difference of 0.060%), Tlingit-Haida (11.7%, a difference of 0.070%), and Soviet Union (11.7%, a difference of 0.090%).
| Demographics | Rating | Rank | Poverty |
| Argentineans | 89.1 /100 | #118 | Excellent 11.7% |
| Tlingit-Haida | 89.0 /100 | #119 | Excellent 11.7% |
| Immigrants | South Eastern Asia | 88.9 /100 | #120 | Excellent 11.7% |
| New Zealanders | 88.7 /100 | #121 | Excellent 11.7% |
| Puget Sound Salish | 88.7 /100 | #122 | Excellent 11.7% |
| Immigrants | Hungary | 88.6 /100 | #123 | Excellent 11.7% |
| Soviet Union | 88.4 /100 | #124 | Excellent 11.7% |
| Immigrants | Brazil | 88.2 /100 | #125 | Excellent 11.7% |
| Immigrants | Norway | 88.0 /100 | #126 | Excellent 11.7% |
| Immigrants | Argentina | 88.0 /100 | #127 | Excellent 11.7% |
| Immigrants | Israel | 87.4 /100 | #128 | Excellent 11.7% |
| South Africans | 87.0 /100 | #129 | Excellent 11.7% |
| Immigrants | Ukraine | 86.6 /100 | #130 | Excellent 11.8% |
| French | 86.1 /100 | #131 | Excellent 11.8% |
| Peruvians | 85.6 /100 | #132 | Excellent 11.8% |
| Immigrants | Western Europe | 85.2 /100 | #133 | Excellent 11.8% |
| Yugoslavians | 85.2 /100 | #134 | Excellent 11.8% |
| Immigrants | Vietnam | 85.2 /100 | #135 | Excellent 11.8% |
| Chileans | 84.2 /100 | #136 | Excellent 11.8% |
| Immigrants | Switzerland | 83.0 /100 | #137 | Excellent 11.8% |
| Immigrants | Jordan | 82.4 /100 | #138 | Excellent 11.9% |