Immigrants from Vietnam vs Immigrants from Belarus Child Poverty Under the Age of 16
COMPARE
Immigrants from Vietnam
Immigrants from Belarus
Child Poverty Under the Age of 16
Child Poverty Under the Age of 16 Comparison
Immigrants from Vietnam
Immigrants from Belarus
15.3%
CHILD POVERTY UNDER THE AGE OF 16
87.1/ 100
METRIC RATING
139th/ 347
METRIC RANK
14.7%
CHILD POVERTY UNDER THE AGE OF 16
95.7/ 100
METRIC RATING
98th/ 347
METRIC RANK
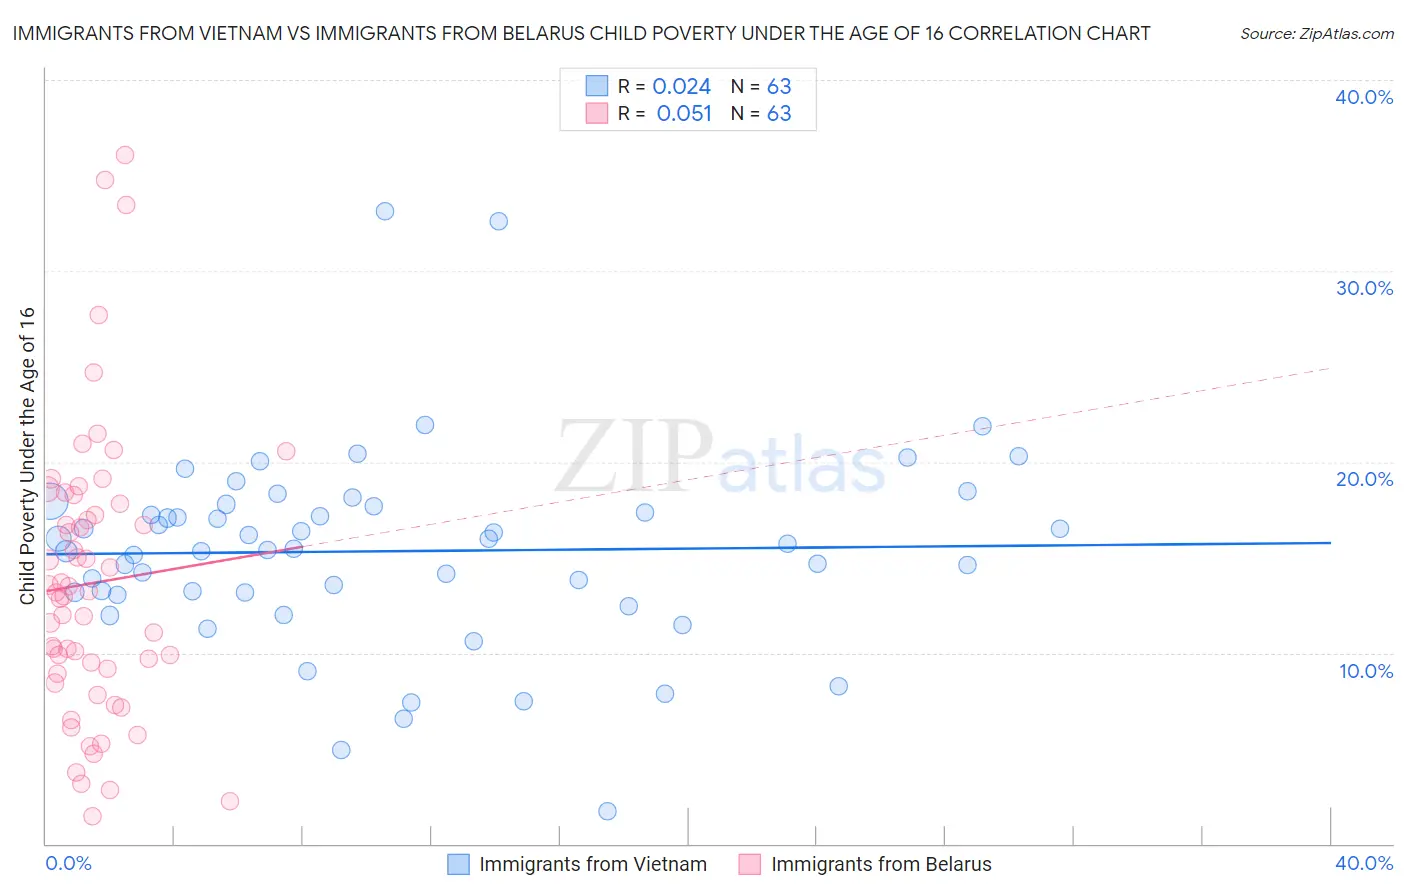
Immigrants from Vietnam vs Immigrants from Belarus Child Poverty Under the Age of 16 Correlation Chart
The statistical analysis conducted on geographies consisting of 401,810,558 people shows no correlation between the proportion of Immigrants from Vietnam and poverty level among children under the age of 16 in the United States with a correlation coefficient (R) of 0.024 and weighted average of 15.3%. Similarly, the statistical analysis conducted on geographies consisting of 149,586,337 people shows a slight positive correlation between the proportion of Immigrants from Belarus and poverty level among children under the age of 16 in the United States with a correlation coefficient (R) of 0.051 and weighted average of 14.7%, a difference of 3.9%.
Child Poverty Under the Age of 16 Correlation Summary
| Measurement | Immigrants from Vietnam | Immigrants from Belarus |
| Minimum | 1.7% | 1.5% |
| Maximum | 33.1% | 36.1% |
| Range | 31.4% | 34.6% |
| Mean | 15.3% | 13.7% |
| Median | 15.4% | 13.1% |
| Interquartile 25% (IQ1) | 13.1% | 8.9% |
| Interquartile 75% (IQ3) | 17.7% | 17.8% |
| Interquartile Range (IQR) | 4.6% | 8.9% |
| Standard Deviation (Sample) | 5.2% | 7.4% |
| Standard Deviation (Population) | 5.1% | 7.4% |
Similar Demographics by Child Poverty Under the Age of 16
Demographics Similar to Immigrants from Vietnam by Child Poverty Under the Age of 16
In terms of child poverty under the age of 16, the demographic groups most similar to Immigrants from Vietnam are Welsh (15.3%, a difference of 0.040%), Peruvian (15.3%, a difference of 0.050%), New Zealander (15.3%, a difference of 0.060%), Immigrants from Spain (15.3%, a difference of 0.080%), and Albanian (15.2%, a difference of 0.45%).
| Demographics | Rating | Rank | Child Poverty Under the Age of 16 |
| Canadians | 89.1 /100 | #132 | Excellent 15.2% |
| Immigrants | South Eastern Asia | 89.0 /100 | #133 | Excellent 15.2% |
| Native Hawaiians | 88.7 /100 | #134 | Excellent 15.2% |
| Albanians | 88.6 /100 | #135 | Excellent 15.2% |
| Immigrants | Spain | 87.3 /100 | #136 | Excellent 15.3% |
| Peruvians | 87.2 /100 | #137 | Excellent 15.3% |
| Welsh | 87.2 /100 | #138 | Excellent 15.3% |
| Immigrants | Vietnam | 87.1 /100 | #139 | Excellent 15.3% |
| New Zealanders | 86.9 /100 | #140 | Excellent 15.3% |
| Slavs | 84.2 /100 | #141 | Excellent 15.4% |
| Brazilians | 82.8 /100 | #142 | Excellent 15.4% |
| Icelanders | 82.5 /100 | #143 | Excellent 15.4% |
| Immigrants | Hungary | 81.9 /100 | #144 | Excellent 15.5% |
| Immigrants | Peru | 81.7 /100 | #145 | Excellent 15.5% |
| Slovaks | 81.4 /100 | #146 | Excellent 15.5% |
Demographics Similar to Immigrants from Belarus by Child Poverty Under the Age of 16
In terms of child poverty under the age of 16, the demographic groups most similar to Immigrants from Belarus are Paraguayan (14.7%, a difference of 0.010%), British (14.7%, a difference of 0.12%), Immigrants from France (14.7%, a difference of 0.13%), Immigrants from Croatia (14.6%, a difference of 0.37%), and Dutch (14.8%, a difference of 0.44%).
| Demographics | Rating | Rank | Child Poverty Under the Age of 16 |
| Immigrants | North America | 96.7 /100 | #91 | Exceptional 14.6% |
| Immigrants | Italy | 96.7 /100 | #92 | Exceptional 14.6% |
| Argentineans | 96.6 /100 | #93 | Exceptional 14.6% |
| Immigrants | South Africa | 96.3 /100 | #94 | Exceptional 14.6% |
| Immigrants | Croatia | 96.1 /100 | #95 | Exceptional 14.6% |
| Immigrants | France | 95.8 /100 | #96 | Exceptional 14.7% |
| Paraguayans | 95.7 /100 | #97 | Exceptional 14.7% |
| Immigrants | Belarus | 95.7 /100 | #98 | Exceptional 14.7% |
| British | 95.5 /100 | #99 | Exceptional 14.7% |
| Dutch | 95.1 /100 | #100 | Exceptional 14.8% |
| Immigrants | Switzerland | 95.1 /100 | #101 | Exceptional 14.8% |
| Romanians | 95.0 /100 | #102 | Exceptional 14.8% |
| Immigrants | Egypt | 94.9 /100 | #103 | Exceptional 14.8% |
| Immigrants | England | 94.8 /100 | #104 | Exceptional 14.8% |
| Basques | 94.7 /100 | #105 | Exceptional 14.8% |