Immigrants from Mexico vs Immigrants from Belarus Child Poverty Under the Age of 16
COMPARE
Immigrants from Mexico
Immigrants from Belarus
Child Poverty Under the Age of 16
Child Poverty Under the Age of 16 Comparison
Immigrants from Mexico
Immigrants from Belarus
21.5%
CHILD POVERTY UNDER THE AGE OF 16
0.0/ 100
METRIC RATING
309th/ 347
METRIC RANK
14.7%
CHILD POVERTY UNDER THE AGE OF 16
95.7/ 100
METRIC RATING
98th/ 347
METRIC RANK
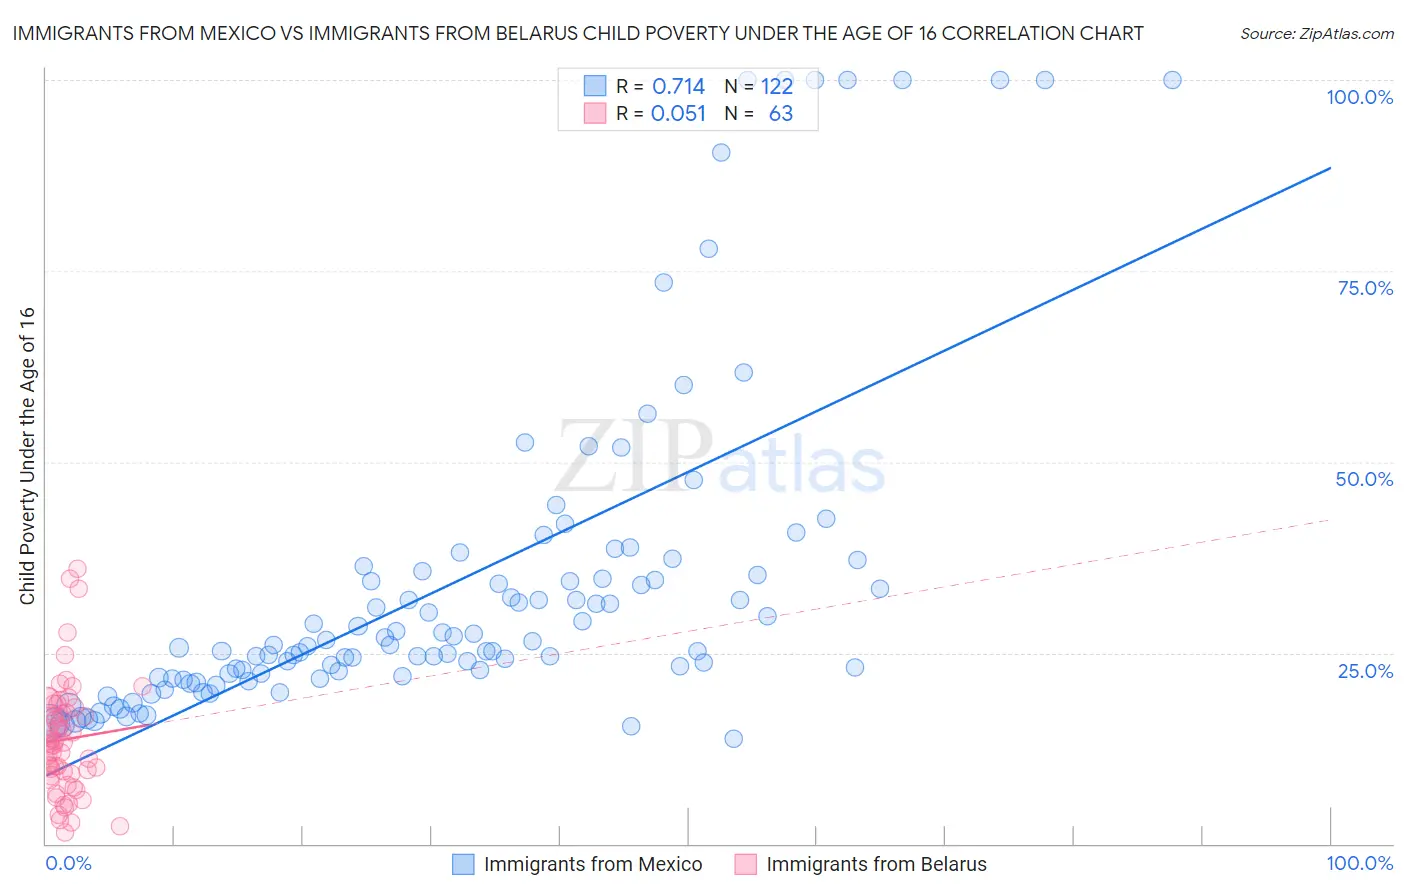
Immigrants from Mexico vs Immigrants from Belarus Child Poverty Under the Age of 16 Correlation Chart
The statistical analysis conducted on geographies consisting of 507,818,297 people shows a strong positive correlation between the proportion of Immigrants from Mexico and poverty level among children under the age of 16 in the United States with a correlation coefficient (R) of 0.714 and weighted average of 21.5%. Similarly, the statistical analysis conducted on geographies consisting of 149,586,337 people shows a slight positive correlation between the proportion of Immigrants from Belarus and poverty level among children under the age of 16 in the United States with a correlation coefficient (R) of 0.051 and weighted average of 14.7%, a difference of 45.9%.
Child Poverty Under the Age of 16 Correlation Summary
| Measurement | Immigrants from Mexico | Immigrants from Belarus |
| Minimum | 13.8% | 1.5% |
| Maximum | 100.0% | 36.1% |
| Range | 86.2% | 34.6% |
| Mean | 33.9% | 13.7% |
| Median | 26.0% | 13.1% |
| Interquartile 25% (IQ1) | 21.8% | 8.9% |
| Interquartile 75% (IQ3) | 35.2% | 17.8% |
| Interquartile Range (IQR) | 13.4% | 8.9% |
| Standard Deviation (Sample) | 21.6% | 7.4% |
| Standard Deviation (Population) | 21.5% | 7.4% |
Similar Demographics by Child Poverty Under the Age of 16
Demographics Similar to Immigrants from Mexico by Child Poverty Under the Age of 16
In terms of child poverty under the age of 16, the demographic groups most similar to Immigrants from Mexico are Bahamian (21.5%, a difference of 0.030%), Dutch West Indian (21.5%, a difference of 0.12%), Ute (21.5%, a difference of 0.37%), Creek (21.5%, a difference of 0.39%), and Immigrants from Somalia (21.6%, a difference of 0.60%).
| Demographics | Rating | Rank | Child Poverty Under the Age of 16 |
| Immigrants | Bahamas | 0.0 /100 | #302 | Tragic 21.0% |
| Choctaw | 0.0 /100 | #303 | Tragic 21.0% |
| Somalis | 0.0 /100 | #304 | Tragic 21.0% |
| Seminole | 0.0 /100 | #305 | Tragic 21.1% |
| Guatemalans | 0.0 /100 | #306 | Tragic 21.2% |
| Immigrants | Central America | 0.0 /100 | #307 | Tragic 21.3% |
| British West Indians | 0.0 /100 | #308 | Tragic 21.3% |
| Immigrants | Mexico | 0.0 /100 | #309 | Tragic 21.5% |
| Bahamians | 0.0 /100 | #310 | Tragic 21.5% |
| Dutch West Indians | 0.0 /100 | #311 | Tragic 21.5% |
| Ute | 0.0 /100 | #312 | Tragic 21.5% |
| Creek | 0.0 /100 | #313 | Tragic 21.5% |
| Immigrants | Somalia | 0.0 /100 | #314 | Tragic 21.6% |
| Immigrants | Guatemala | 0.0 /100 | #315 | Tragic 21.6% |
| Africans | 0.0 /100 | #316 | Tragic 21.7% |
Demographics Similar to Immigrants from Belarus by Child Poverty Under the Age of 16
In terms of child poverty under the age of 16, the demographic groups most similar to Immigrants from Belarus are Paraguayan (14.7%, a difference of 0.010%), British (14.7%, a difference of 0.12%), Immigrants from France (14.7%, a difference of 0.13%), Immigrants from Croatia (14.6%, a difference of 0.37%), and Dutch (14.8%, a difference of 0.44%).
| Demographics | Rating | Rank | Child Poverty Under the Age of 16 |
| Immigrants | North America | 96.7 /100 | #91 | Exceptional 14.6% |
| Immigrants | Italy | 96.7 /100 | #92 | Exceptional 14.6% |
| Argentineans | 96.6 /100 | #93 | Exceptional 14.6% |
| Immigrants | South Africa | 96.3 /100 | #94 | Exceptional 14.6% |
| Immigrants | Croatia | 96.1 /100 | #95 | Exceptional 14.6% |
| Immigrants | France | 95.8 /100 | #96 | Exceptional 14.7% |
| Paraguayans | 95.7 /100 | #97 | Exceptional 14.7% |
| Immigrants | Belarus | 95.7 /100 | #98 | Exceptional 14.7% |
| British | 95.5 /100 | #99 | Exceptional 14.7% |
| Dutch | 95.1 /100 | #100 | Exceptional 14.8% |
| Immigrants | Switzerland | 95.1 /100 | #101 | Exceptional 14.8% |
| Romanians | 95.0 /100 | #102 | Exceptional 14.8% |
| Immigrants | Egypt | 94.9 /100 | #103 | Exceptional 14.8% |
| Immigrants | England | 94.8 /100 | #104 | Exceptional 14.8% |
| Basques | 94.7 /100 | #105 | Exceptional 14.8% |