Hungarian vs Immigrants from Belarus Child Poverty Under the Age of 16
COMPARE
Hungarian
Immigrants from Belarus
Child Poverty Under the Age of 16
Child Poverty Under the Age of 16 Comparison
Hungarians
Immigrants from Belarus
16.2%
CHILD POVERTY UNDER THE AGE OF 16
52.5/ 100
METRIC RATING
171st/ 347
METRIC RANK
14.7%
CHILD POVERTY UNDER THE AGE OF 16
95.7/ 100
METRIC RATING
98th/ 347
METRIC RANK
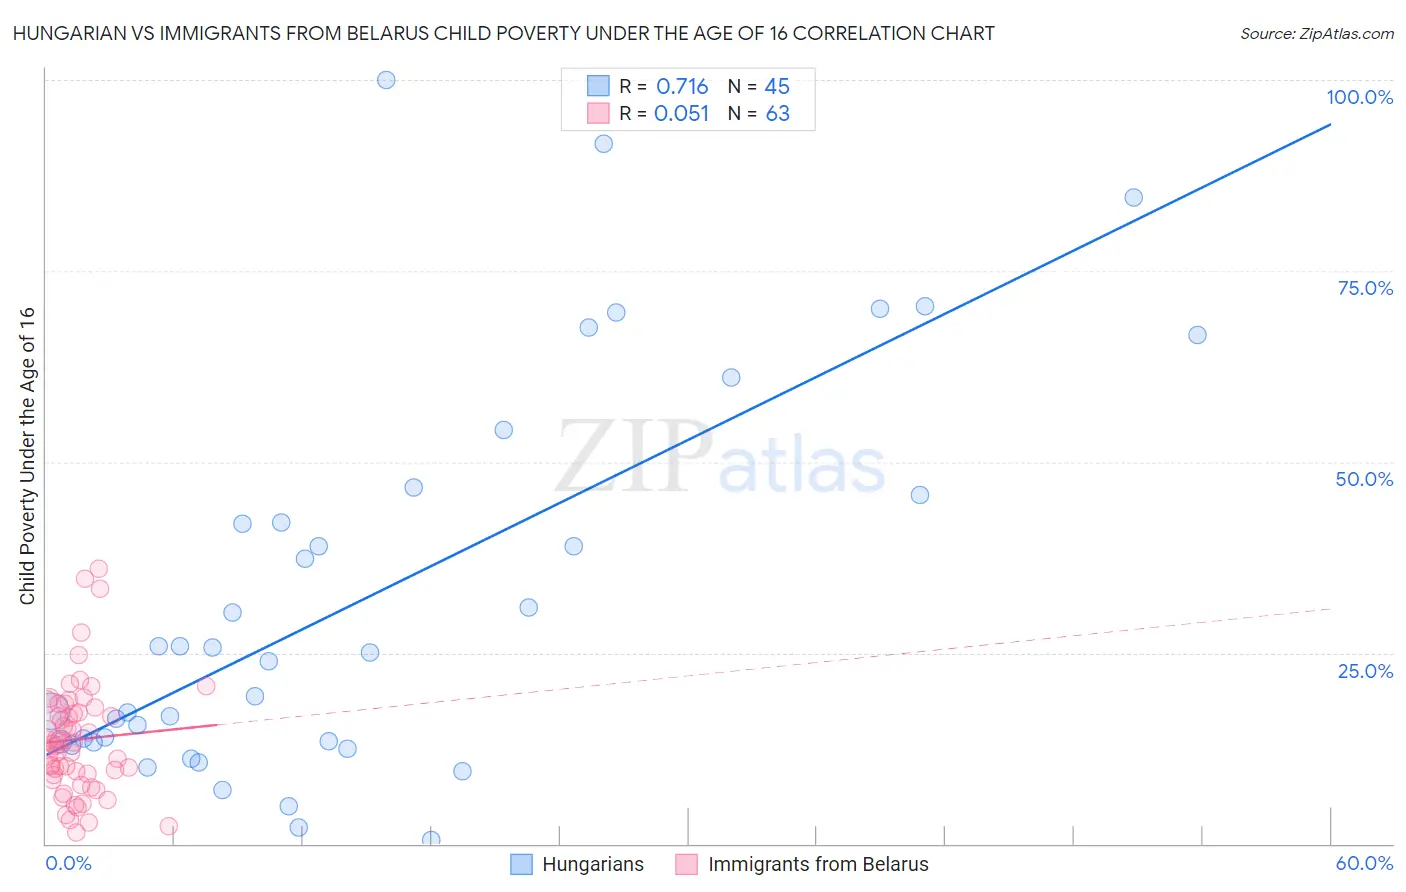
Hungarian vs Immigrants from Belarus Child Poverty Under the Age of 16 Correlation Chart
The statistical analysis conducted on geographies consisting of 478,420,281 people shows a strong positive correlation between the proportion of Hungarians and poverty level among children under the age of 16 in the United States with a correlation coefficient (R) of 0.716 and weighted average of 16.2%. Similarly, the statistical analysis conducted on geographies consisting of 149,586,337 people shows a slight positive correlation between the proportion of Immigrants from Belarus and poverty level among children under the age of 16 in the United States with a correlation coefficient (R) of 0.051 and weighted average of 14.7%, a difference of 9.9%.
Child Poverty Under the Age of 16 Correlation Summary
| Measurement | Hungarian | Immigrants from Belarus |
| Minimum | 0.42% | 1.5% |
| Maximum | 100.0% | 36.1% |
| Range | 99.6% | 34.6% |
| Mean | 32.6% | 13.7% |
| Median | 25.0% | 13.1% |
| Interquartile 25% (IQ1) | 13.3% | 8.9% |
| Interquartile 75% (IQ3) | 46.1% | 17.8% |
| Interquartile Range (IQR) | 32.8% | 8.9% |
| Standard Deviation (Sample) | 25.6% | 7.4% |
| Standard Deviation (Population) | 25.4% | 7.4% |
Similar Demographics by Child Poverty Under the Age of 16
Demographics Similar to Hungarians by Child Poverty Under the Age of 16
In terms of child poverty under the age of 16, the demographic groups most similar to Hungarians are Afghan (16.2%, a difference of 0.020%), Immigrants from Saudi Arabia (16.2%, a difference of 0.050%), Immigrants from Colombia (16.1%, a difference of 0.23%), Uruguayan (16.1%, a difference of 0.27%), and White/Caucasian (16.2%, a difference of 0.30%).
| Demographics | Rating | Rank | Child Poverty Under the Age of 16 |
| Immigrants | Germany | 67.3 /100 | #164 | Good 15.8% |
| Guamanians/Chamorros | 66.4 /100 | #165 | Good 15.9% |
| Immigrants | Oceania | 65.4 /100 | #166 | Good 15.9% |
| Costa Ricans | 61.1 /100 | #167 | Good 16.0% |
| South Americans | 57.9 /100 | #168 | Average 16.0% |
| Uruguayans | 54.7 /100 | #169 | Average 16.1% |
| Immigrants | Colombia | 54.4 /100 | #170 | Average 16.1% |
| Hungarians | 52.5 /100 | #171 | Average 16.2% |
| Afghans | 52.3 /100 | #172 | Average 16.2% |
| Immigrants | Saudi Arabia | 52.1 /100 | #173 | Average 16.2% |
| Whites/Caucasians | 50.0 /100 | #174 | Average 16.2% |
| Scotch-Irish | 47.1 /100 | #175 | Average 16.3% |
| Lebanese | 45.9 /100 | #176 | Average 16.3% |
| Ethiopians | 43.4 /100 | #177 | Average 16.3% |
| Immigrants | Ethiopia | 42.3 /100 | #178 | Average 16.4% |
Demographics Similar to Immigrants from Belarus by Child Poverty Under the Age of 16
In terms of child poverty under the age of 16, the demographic groups most similar to Immigrants from Belarus are Paraguayan (14.7%, a difference of 0.010%), British (14.7%, a difference of 0.12%), Immigrants from France (14.7%, a difference of 0.13%), Immigrants from Croatia (14.6%, a difference of 0.37%), and Dutch (14.8%, a difference of 0.44%).
| Demographics | Rating | Rank | Child Poverty Under the Age of 16 |
| Immigrants | North America | 96.7 /100 | #91 | Exceptional 14.6% |
| Immigrants | Italy | 96.7 /100 | #92 | Exceptional 14.6% |
| Argentineans | 96.6 /100 | #93 | Exceptional 14.6% |
| Immigrants | South Africa | 96.3 /100 | #94 | Exceptional 14.6% |
| Immigrants | Croatia | 96.1 /100 | #95 | Exceptional 14.6% |
| Immigrants | France | 95.8 /100 | #96 | Exceptional 14.7% |
| Paraguayans | 95.7 /100 | #97 | Exceptional 14.7% |
| Immigrants | Belarus | 95.7 /100 | #98 | Exceptional 14.7% |
| British | 95.5 /100 | #99 | Exceptional 14.7% |
| Dutch | 95.1 /100 | #100 | Exceptional 14.8% |
| Immigrants | Switzerland | 95.1 /100 | #101 | Exceptional 14.8% |
| Romanians | 95.0 /100 | #102 | Exceptional 14.8% |
| Immigrants | Egypt | 94.9 /100 | #103 | Exceptional 14.8% |
| Immigrants | England | 94.8 /100 | #104 | Exceptional 14.8% |
| Basques | 94.7 /100 | #105 | Exceptional 14.8% |