Immigrants from Vietnam vs Immigrants from South Central Asia Child Poverty Under the Age of 16
COMPARE
Immigrants from Vietnam
Immigrants from South Central Asia
Child Poverty Under the Age of 16
Child Poverty Under the Age of 16 Comparison
Immigrants from Vietnam
Immigrants from South Central Asia
15.3%
CHILD POVERTY UNDER THE AGE OF 16
87.1/ 100
METRIC RATING
139th/ 347
METRIC RANK
12.5%
CHILD POVERTY UNDER THE AGE OF 16
99.9/ 100
METRIC RATING
10th/ 347
METRIC RANK
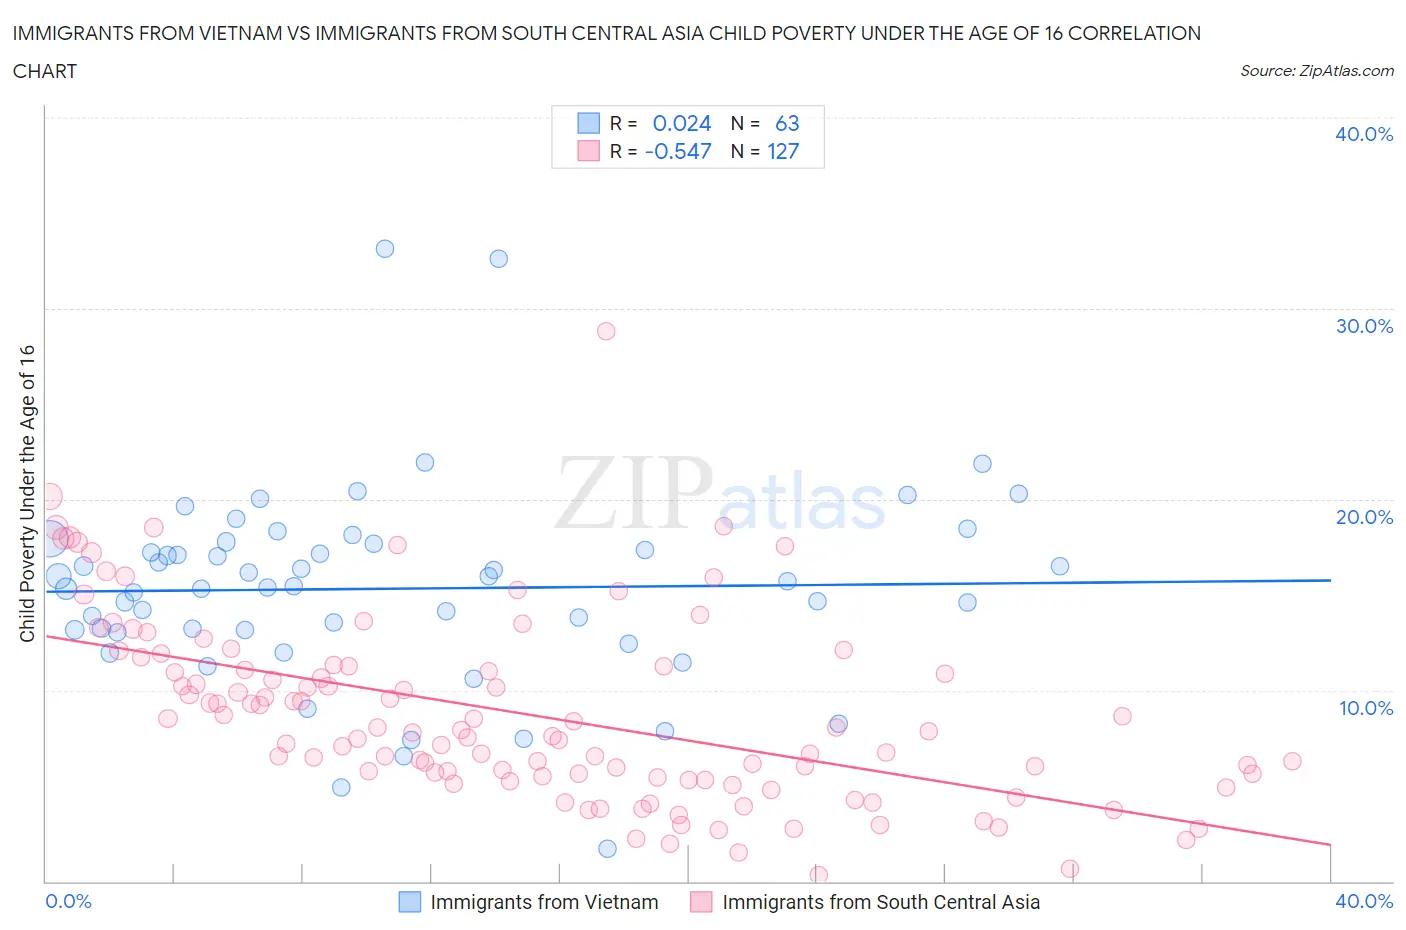
Immigrants from Vietnam vs Immigrants from South Central Asia Child Poverty Under the Age of 16 Correlation Chart
The statistical analysis conducted on geographies consisting of 401,810,558 people shows no correlation between the proportion of Immigrants from Vietnam and poverty level among children under the age of 16 in the United States with a correlation coefficient (R) of 0.024 and weighted average of 15.3%. Similarly, the statistical analysis conducted on geographies consisting of 466,904,783 people shows a substantial negative correlation between the proportion of Immigrants from South Central Asia and poverty level among children under the age of 16 in the United States with a correlation coefficient (R) of -0.547 and weighted average of 12.5%, a difference of 22.0%.
Child Poverty Under the Age of 16 Correlation Summary
| Measurement | Immigrants from Vietnam | Immigrants from South Central Asia |
| Minimum | 1.7% | 0.35% |
| Maximum | 33.1% | 28.8% |
| Range | 31.4% | 28.5% |
| Mean | 15.3% | 8.8% |
| Median | 15.4% | 7.9% |
| Interquartile 25% (IQ1) | 13.1% | 5.4% |
| Interquartile 75% (IQ3) | 17.7% | 11.3% |
| Interquartile Range (IQR) | 4.6% | 5.9% |
| Standard Deviation (Sample) | 5.2% | 4.9% |
| Standard Deviation (Population) | 5.1% | 4.8% |
Similar Demographics by Child Poverty Under the Age of 16
Demographics Similar to Immigrants from Vietnam by Child Poverty Under the Age of 16
In terms of child poverty under the age of 16, the demographic groups most similar to Immigrants from Vietnam are Welsh (15.3%, a difference of 0.040%), Peruvian (15.3%, a difference of 0.050%), New Zealander (15.3%, a difference of 0.060%), Immigrants from Spain (15.3%, a difference of 0.080%), and Albanian (15.2%, a difference of 0.45%).
| Demographics | Rating | Rank | Child Poverty Under the Age of 16 |
| Canadians | 89.1 /100 | #132 | Excellent 15.2% |
| Immigrants | South Eastern Asia | 89.0 /100 | #133 | Excellent 15.2% |
| Native Hawaiians | 88.7 /100 | #134 | Excellent 15.2% |
| Albanians | 88.6 /100 | #135 | Excellent 15.2% |
| Immigrants | Spain | 87.3 /100 | #136 | Excellent 15.3% |
| Peruvians | 87.2 /100 | #137 | Excellent 15.3% |
| Welsh | 87.2 /100 | #138 | Excellent 15.3% |
| Immigrants | Vietnam | 87.1 /100 | #139 | Excellent 15.3% |
| New Zealanders | 86.9 /100 | #140 | Excellent 15.3% |
| Slavs | 84.2 /100 | #141 | Excellent 15.4% |
| Brazilians | 82.8 /100 | #142 | Excellent 15.4% |
| Icelanders | 82.5 /100 | #143 | Excellent 15.4% |
| Immigrants | Hungary | 81.9 /100 | #144 | Excellent 15.5% |
| Immigrants | Peru | 81.7 /100 | #145 | Excellent 15.5% |
| Slovaks | 81.4 /100 | #146 | Excellent 15.5% |
Demographics Similar to Immigrants from South Central Asia by Child Poverty Under the Age of 16
In terms of child poverty under the age of 16, the demographic groups most similar to Immigrants from South Central Asia are Bhutanese (12.5%, a difference of 0.010%), Immigrants from Ireland (12.7%, a difference of 1.1%), Immigrants from Iran (12.4%, a difference of 1.2%), Immigrants from Singapore (12.4%, a difference of 1.3%), and Burmese (12.8%, a difference of 2.2%).
| Demographics | Rating | Rank | Child Poverty Under the Age of 16 |
| Filipinos | 100.0 /100 | #3 | Exceptional 11.1% |
| Thais | 100.0 /100 | #4 | Exceptional 11.6% |
| Chinese | 100.0 /100 | #5 | Exceptional 11.9% |
| Immigrants | Hong Kong | 100.0 /100 | #6 | Exceptional 12.1% |
| Iranians | 100.0 /100 | #7 | Exceptional 12.2% |
| Immigrants | Singapore | 100.0 /100 | #8 | Exceptional 12.4% |
| Immigrants | Iran | 100.0 /100 | #9 | Exceptional 12.4% |
| Immigrants | South Central Asia | 99.9 /100 | #10 | Exceptional 12.5% |
| Bhutanese | 99.9 /100 | #11 | Exceptional 12.5% |
| Immigrants | Ireland | 99.9 /100 | #12 | Exceptional 12.7% |
| Burmese | 99.9 /100 | #13 | Exceptional 12.8% |
| Immigrants | Lithuania | 99.9 /100 | #14 | Exceptional 12.9% |
| Immigrants | Korea | 99.9 /100 | #15 | Exceptional 13.0% |
| Norwegians | 99.9 /100 | #16 | Exceptional 13.0% |
| Bulgarians | 99.9 /100 | #17 | Exceptional 13.0% |