Immigrants from Vietnam vs Immigrants from South America Child Poverty Under the Age of 16
COMPARE
Immigrants from Vietnam
Immigrants from South America
Child Poverty Under the Age of 16
Child Poverty Under the Age of 16 Comparison
Immigrants from Vietnam
Immigrants from South America
15.3%
CHILD POVERTY UNDER THE AGE OF 16
87.1/ 100
METRIC RATING
139th/ 347
METRIC RANK
16.4%
CHILD POVERTY UNDER THE AGE OF 16
40.8/ 100
METRIC RATING
181st/ 347
METRIC RANK
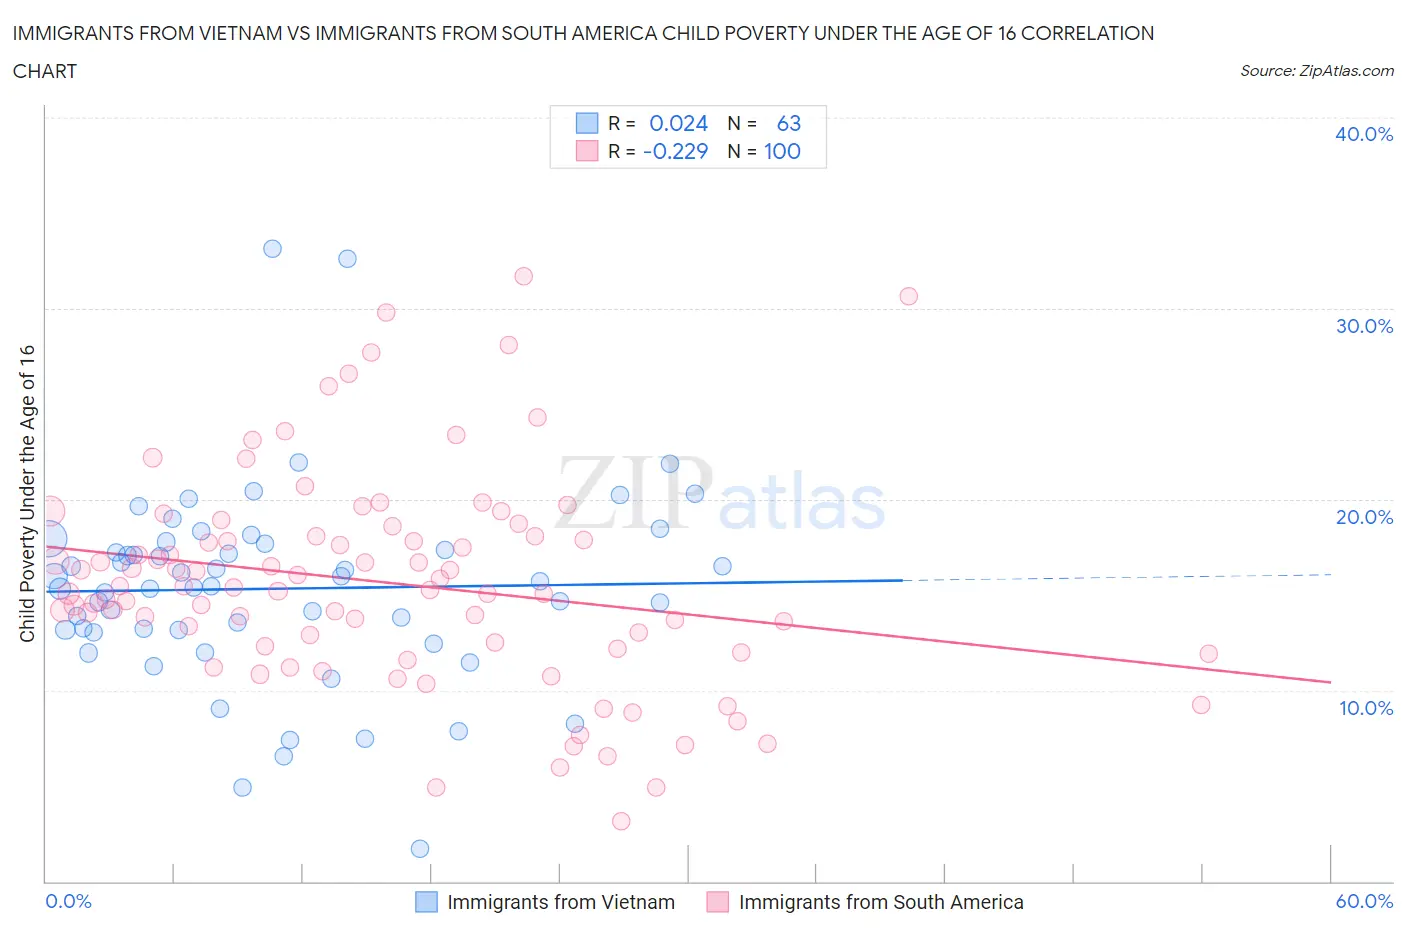
Immigrants from Vietnam vs Immigrants from South America Child Poverty Under the Age of 16 Correlation Chart
The statistical analysis conducted on geographies consisting of 401,810,558 people shows no correlation between the proportion of Immigrants from Vietnam and poverty level among children under the age of 16 in the United States with a correlation coefficient (R) of 0.024 and weighted average of 15.3%. Similarly, the statistical analysis conducted on geographies consisting of 479,730,201 people shows a weak negative correlation between the proportion of Immigrants from South America and poverty level among children under the age of 16 in the United States with a correlation coefficient (R) of -0.229 and weighted average of 16.4%, a difference of 7.2%.
Child Poverty Under the Age of 16 Correlation Summary
| Measurement | Immigrants from Vietnam | Immigrants from South America |
| Minimum | 1.7% | 3.2% |
| Maximum | 33.1% | 31.7% |
| Range | 31.4% | 28.5% |
| Mean | 15.3% | 15.6% |
| Median | 15.4% | 15.3% |
| Interquartile 25% (IQ1) | 13.1% | 12.2% |
| Interquartile 75% (IQ3) | 17.7% | 18.1% |
| Interquartile Range (IQR) | 4.6% | 5.8% |
| Standard Deviation (Sample) | 5.2% | 5.6% |
| Standard Deviation (Population) | 5.1% | 5.6% |
Similar Demographics by Child Poverty Under the Age of 16
Demographics Similar to Immigrants from Vietnam by Child Poverty Under the Age of 16
In terms of child poverty under the age of 16, the demographic groups most similar to Immigrants from Vietnam are Welsh (15.3%, a difference of 0.040%), Peruvian (15.3%, a difference of 0.050%), New Zealander (15.3%, a difference of 0.060%), Immigrants from Spain (15.3%, a difference of 0.080%), and Albanian (15.2%, a difference of 0.45%).
| Demographics | Rating | Rank | Child Poverty Under the Age of 16 |
| Canadians | 89.1 /100 | #132 | Excellent 15.2% |
| Immigrants | South Eastern Asia | 89.0 /100 | #133 | Excellent 15.2% |
| Native Hawaiians | 88.7 /100 | #134 | Excellent 15.2% |
| Albanians | 88.6 /100 | #135 | Excellent 15.2% |
| Immigrants | Spain | 87.3 /100 | #136 | Excellent 15.3% |
| Peruvians | 87.2 /100 | #137 | Excellent 15.3% |
| Welsh | 87.2 /100 | #138 | Excellent 15.3% |
| Immigrants | Vietnam | 87.1 /100 | #139 | Excellent 15.3% |
| New Zealanders | 86.9 /100 | #140 | Excellent 15.3% |
| Slavs | 84.2 /100 | #141 | Excellent 15.4% |
| Brazilians | 82.8 /100 | #142 | Excellent 15.4% |
| Icelanders | 82.5 /100 | #143 | Excellent 15.4% |
| Immigrants | Hungary | 81.9 /100 | #144 | Excellent 15.5% |
| Immigrants | Peru | 81.7 /100 | #145 | Excellent 15.5% |
| Slovaks | 81.4 /100 | #146 | Excellent 15.5% |
Demographics Similar to Immigrants from South America by Child Poverty Under the Age of 16
In terms of child poverty under the age of 16, the demographic groups most similar to Immigrants from South America are South American Indian (16.4%, a difference of 0.12%), Immigrants from Ethiopia (16.4%, a difference of 0.18%), Immigrants from Syria (16.4%, a difference of 0.18%), Ethiopian (16.3%, a difference of 0.31%), and Hawaiian (16.4%, a difference of 0.32%).
| Demographics | Rating | Rank | Child Poverty Under the Age of 16 |
| Whites/Caucasians | 50.0 /100 | #174 | Average 16.2% |
| Scotch-Irish | 47.1 /100 | #175 | Average 16.3% |
| Lebanese | 45.9 /100 | #176 | Average 16.3% |
| Ethiopians | 43.4 /100 | #177 | Average 16.3% |
| Immigrants | Ethiopia | 42.3 /100 | #178 | Average 16.4% |
| Immigrants | Syria | 42.3 /100 | #179 | Average 16.4% |
| South American Indians | 41.8 /100 | #180 | Average 16.4% |
| Immigrants | South America | 40.8 /100 | #181 | Average 16.4% |
| Hawaiians | 38.2 /100 | #182 | Fair 16.4% |
| Celtics | 38.2 /100 | #183 | Fair 16.4% |
| Immigrants | Western Asia | 38.0 /100 | #184 | Fair 16.4% |
| Immigrants | Bosnia and Herzegovina | 37.4 /100 | #185 | Fair 16.5% |
| Kenyans | 34.1 /100 | #186 | Fair 16.5% |
| Arabs | 31.4 /100 | #187 | Fair 16.6% |
| Immigrants | Morocco | 31.2 /100 | #188 | Fair 16.6% |