Honduran vs Immigrants from Belarus Child Poverty Under the Age of 16
COMPARE
Honduran
Immigrants from Belarus
Child Poverty Under the Age of 16
Child Poverty Under the Age of 16 Comparison
Hondurans
Immigrants from Belarus
22.2%
CHILD POVERTY UNDER THE AGE OF 16
0.0/ 100
METRIC RATING
322nd/ 347
METRIC RANK
14.7%
CHILD POVERTY UNDER THE AGE OF 16
95.7/ 100
METRIC RATING
98th/ 347
METRIC RANK
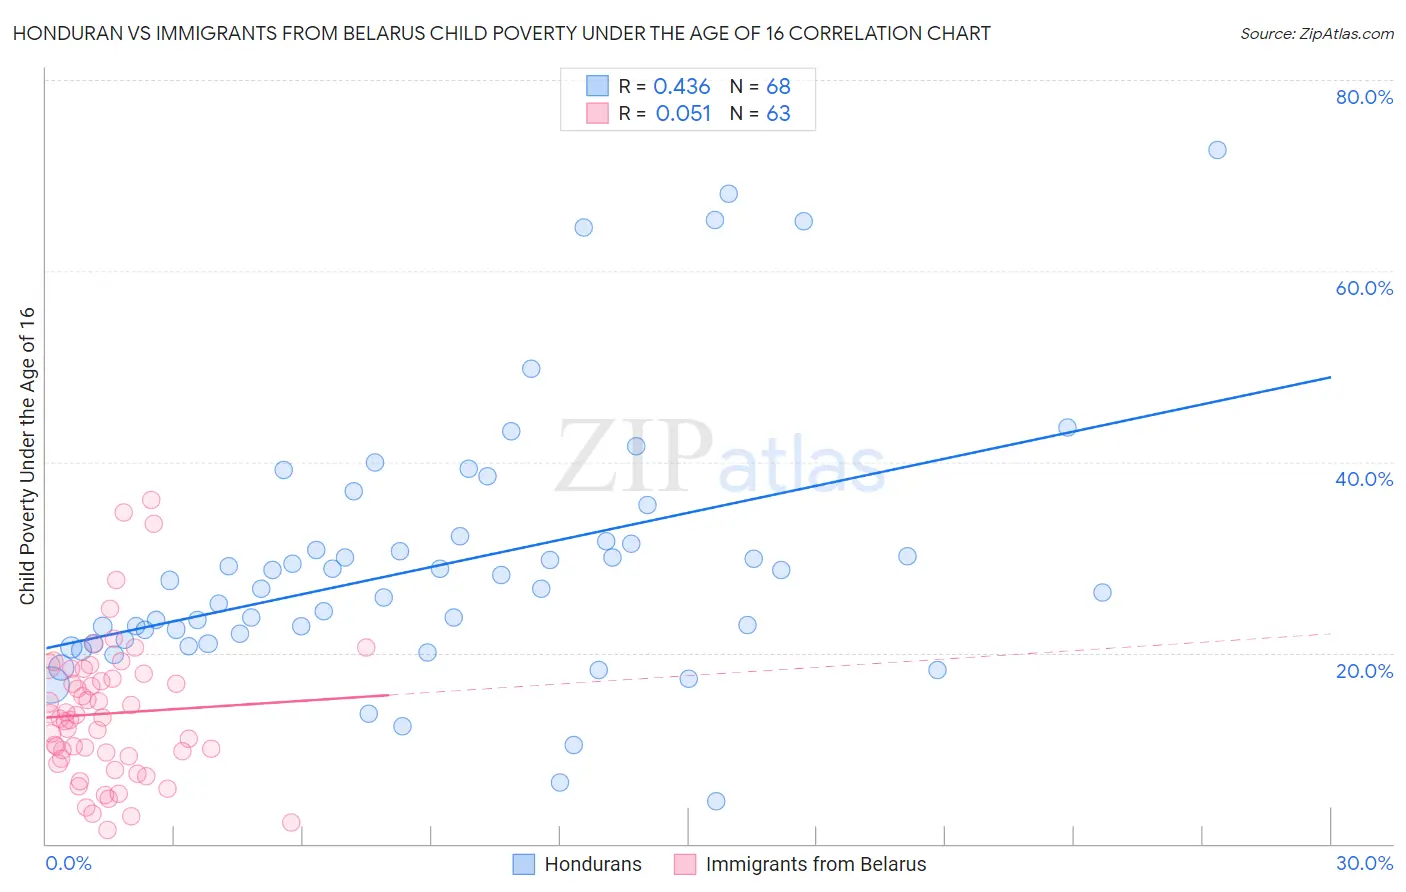
Honduran vs Immigrants from Belarus Child Poverty Under the Age of 16 Correlation Chart
The statistical analysis conducted on geographies consisting of 356,140,791 people shows a moderate positive correlation between the proportion of Hondurans and poverty level among children under the age of 16 in the United States with a correlation coefficient (R) of 0.436 and weighted average of 22.2%. Similarly, the statistical analysis conducted on geographies consisting of 149,586,337 people shows a slight positive correlation between the proportion of Immigrants from Belarus and poverty level among children under the age of 16 in the United States with a correlation coefficient (R) of 0.051 and weighted average of 14.7%, a difference of 51.0%.
Child Poverty Under the Age of 16 Correlation Summary
| Measurement | Honduran | Immigrants from Belarus |
| Minimum | 4.4% | 1.5% |
| Maximum | 72.7% | 36.1% |
| Range | 68.3% | 34.6% |
| Mean | 29.2% | 13.7% |
| Median | 26.8% | 13.1% |
| Interquartile 25% (IQ1) | 21.2% | 8.9% |
| Interquartile 75% (IQ3) | 31.5% | 17.8% |
| Interquartile Range (IQR) | 10.4% | 8.9% |
| Standard Deviation (Sample) | 13.7% | 7.4% |
| Standard Deviation (Population) | 13.6% | 7.4% |
Similar Demographics by Child Poverty Under the Age of 16
Demographics Similar to Hondurans by Child Poverty Under the Age of 16
In terms of child poverty under the age of 16, the demographic groups most similar to Hondurans are Kiowa (22.2%, a difference of 0.19%), Cajun (22.1%, a difference of 0.37%), Yakama (22.1%, a difference of 0.58%), Paiute (22.4%, a difference of 1.0%), and U.S. Virgin Islander (22.0%, a difference of 1.1%).
| Demographics | Rating | Rank | Child Poverty Under the Age of 16 |
| Immigrants | Guatemala | 0.0 /100 | #315 | Tragic 21.6% |
| Africans | 0.0 /100 | #316 | Tragic 21.7% |
| Immigrants | Dominica | 0.0 /100 | #317 | Tragic 21.9% |
| U.S. Virgin Islanders | 0.0 /100 | #318 | Tragic 22.0% |
| Yakama | 0.0 /100 | #319 | Tragic 22.1% |
| Cajuns | 0.0 /100 | #320 | Tragic 22.1% |
| Kiowa | 0.0 /100 | #321 | Tragic 22.2% |
| Hondurans | 0.0 /100 | #322 | Tragic 22.2% |
| Paiute | 0.0 /100 | #323 | Tragic 22.4% |
| Central American Indians | 0.0 /100 | #324 | Tragic 22.5% |
| Immigrants | Congo | 0.0 /100 | #325 | Tragic 22.5% |
| Immigrants | Honduras | 0.0 /100 | #326 | Tragic 22.7% |
| Menominee | 0.0 /100 | #327 | Tragic 23.0% |
| Colville | 0.0 /100 | #328 | Tragic 23.0% |
| Dominicans | 0.0 /100 | #329 | Tragic 23.8% |
Demographics Similar to Immigrants from Belarus by Child Poverty Under the Age of 16
In terms of child poverty under the age of 16, the demographic groups most similar to Immigrants from Belarus are Paraguayan (14.7%, a difference of 0.010%), British (14.7%, a difference of 0.12%), Immigrants from France (14.7%, a difference of 0.13%), Immigrants from Croatia (14.6%, a difference of 0.37%), and Dutch (14.8%, a difference of 0.44%).
| Demographics | Rating | Rank | Child Poverty Under the Age of 16 |
| Immigrants | North America | 96.7 /100 | #91 | Exceptional 14.6% |
| Immigrants | Italy | 96.7 /100 | #92 | Exceptional 14.6% |
| Argentineans | 96.6 /100 | #93 | Exceptional 14.6% |
| Immigrants | South Africa | 96.3 /100 | #94 | Exceptional 14.6% |
| Immigrants | Croatia | 96.1 /100 | #95 | Exceptional 14.6% |
| Immigrants | France | 95.8 /100 | #96 | Exceptional 14.7% |
| Paraguayans | 95.7 /100 | #97 | Exceptional 14.7% |
| Immigrants | Belarus | 95.7 /100 | #98 | Exceptional 14.7% |
| British | 95.5 /100 | #99 | Exceptional 14.7% |
| Dutch | 95.1 /100 | #100 | Exceptional 14.8% |
| Immigrants | Switzerland | 95.1 /100 | #101 | Exceptional 14.8% |
| Romanians | 95.0 /100 | #102 | Exceptional 14.8% |
| Immigrants | Egypt | 94.9 /100 | #103 | Exceptional 14.8% |
| Immigrants | England | 94.8 /100 | #104 | Exceptional 14.8% |
| Basques | 94.7 /100 | #105 | Exceptional 14.8% |