Immigrants from Cabo Verde vs Immigrants from Belarus Child Poverty Under the Age of 16
COMPARE
Immigrants from Cabo Verde
Immigrants from Belarus
Child Poverty Under the Age of 16
Child Poverty Under the Age of 16 Comparison
Immigrants from Cabo Verde
Immigrants from Belarus
19.9%
CHILD POVERTY UNDER THE AGE OF 16
0.1/ 100
METRIC RATING
274th/ 347
METRIC RANK
14.7%
CHILD POVERTY UNDER THE AGE OF 16
95.7/ 100
METRIC RATING
98th/ 347
METRIC RANK
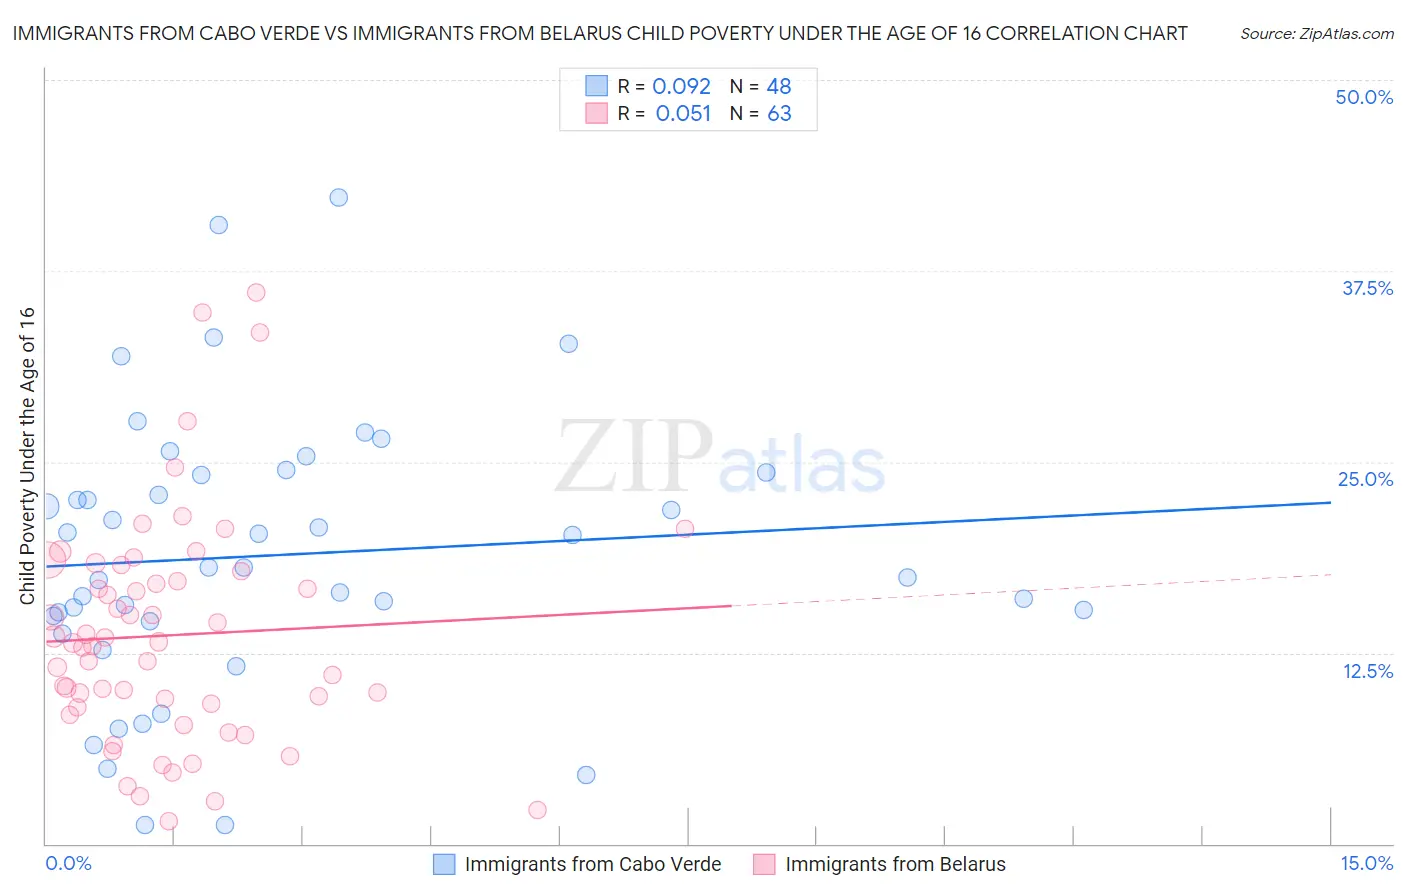
Immigrants from Cabo Verde vs Immigrants from Belarus Child Poverty Under the Age of 16 Correlation Chart
The statistical analysis conducted on geographies consisting of 37,982,036 people shows a slight positive correlation between the proportion of Immigrants from Cabo Verde and poverty level among children under the age of 16 in the United States with a correlation coefficient (R) of 0.092 and weighted average of 19.9%. Similarly, the statistical analysis conducted on geographies consisting of 149,586,337 people shows a slight positive correlation between the proportion of Immigrants from Belarus and poverty level among children under the age of 16 in the United States with a correlation coefficient (R) of 0.051 and weighted average of 14.7%, a difference of 35.0%.
Child Poverty Under the Age of 16 Correlation Summary
| Measurement | Immigrants from Cabo Verde | Immigrants from Belarus |
| Minimum | 1.2% | 1.5% |
| Maximum | 42.3% | 36.1% |
| Range | 41.0% | 34.6% |
| Mean | 18.9% | 13.7% |
| Median | 18.1% | 13.1% |
| Interquartile 25% (IQ1) | 14.7% | 8.9% |
| Interquartile 75% (IQ3) | 24.2% | 17.8% |
| Interquartile Range (IQR) | 9.5% | 8.9% |
| Standard Deviation (Sample) | 9.0% | 7.4% |
| Standard Deviation (Population) | 8.9% | 7.4% |
Similar Demographics by Child Poverty Under the Age of 16
Demographics Similar to Immigrants from Cabo Verde by Child Poverty Under the Age of 16
In terms of child poverty under the age of 16, the demographic groups most similar to Immigrants from Cabo Verde are Immigrants from Barbados (19.9%, a difference of 0.0%), Belizean (19.9%, a difference of 0.0%), Immigrants from Jamaica (19.8%, a difference of 0.15%), Iroquois (19.9%, a difference of 0.15%), and Bangladeshi (19.9%, a difference of 0.24%).
| Demographics | Rating | Rank | Child Poverty Under the Age of 16 |
| Cherokee | 0.1 /100 | #267 | Tragic 19.5% |
| Jamaicans | 0.1 /100 | #268 | Tragic 19.7% |
| Immigrants | El Salvador | 0.1 /100 | #269 | Tragic 19.7% |
| Spanish American Indians | 0.1 /100 | #270 | Tragic 19.7% |
| Immigrants | Liberia | 0.1 /100 | #271 | Tragic 19.7% |
| Immigrants | Bangladesh | 0.1 /100 | #272 | Tragic 19.8% |
| Immigrants | Jamaica | 0.1 /100 | #273 | Tragic 19.8% |
| Immigrants | Cabo Verde | 0.1 /100 | #274 | Tragic 19.9% |
| Immigrants | Barbados | 0.1 /100 | #275 | Tragic 19.9% |
| Belizeans | 0.1 /100 | #276 | Tragic 19.9% |
| Iroquois | 0.1 /100 | #277 | Tragic 19.9% |
| Bangladeshis | 0.0 /100 | #278 | Tragic 19.9% |
| Sub-Saharan Africans | 0.0 /100 | #279 | Tragic 19.9% |
| Comanche | 0.0 /100 | #280 | Tragic 19.9% |
| Central Americans | 0.0 /100 | #281 | Tragic 20.0% |
Demographics Similar to Immigrants from Belarus by Child Poverty Under the Age of 16
In terms of child poverty under the age of 16, the demographic groups most similar to Immigrants from Belarus are Paraguayan (14.7%, a difference of 0.010%), British (14.7%, a difference of 0.12%), Immigrants from France (14.7%, a difference of 0.13%), Immigrants from Croatia (14.6%, a difference of 0.37%), and Dutch (14.8%, a difference of 0.44%).
| Demographics | Rating | Rank | Child Poverty Under the Age of 16 |
| Immigrants | North America | 96.7 /100 | #91 | Exceptional 14.6% |
| Immigrants | Italy | 96.7 /100 | #92 | Exceptional 14.6% |
| Argentineans | 96.6 /100 | #93 | Exceptional 14.6% |
| Immigrants | South Africa | 96.3 /100 | #94 | Exceptional 14.6% |
| Immigrants | Croatia | 96.1 /100 | #95 | Exceptional 14.6% |
| Immigrants | France | 95.8 /100 | #96 | Exceptional 14.7% |
| Paraguayans | 95.7 /100 | #97 | Exceptional 14.7% |
| Immigrants | Belarus | 95.7 /100 | #98 | Exceptional 14.7% |
| British | 95.5 /100 | #99 | Exceptional 14.7% |
| Dutch | 95.1 /100 | #100 | Exceptional 14.8% |
| Immigrants | Switzerland | 95.1 /100 | #101 | Exceptional 14.8% |
| Romanians | 95.0 /100 | #102 | Exceptional 14.8% |
| Immigrants | Egypt | 94.9 /100 | #103 | Exceptional 14.8% |
| Immigrants | England | 94.8 /100 | #104 | Exceptional 14.8% |
| Basques | 94.7 /100 | #105 | Exceptional 14.8% |