Immigrants from Uzbekistan vs Basque 10th Grade
COMPARE
Immigrants from Uzbekistan
Basque
10th Grade
10th Grade Comparison
Immigrants from Uzbekistan
Basques
92.6%
10TH GRADE
0.5/ 100
METRIC RATING
260th/ 347
METRIC RANK
94.3%
10TH GRADE
94.9/ 100
METRIC RATING
124th/ 347
METRIC RANK
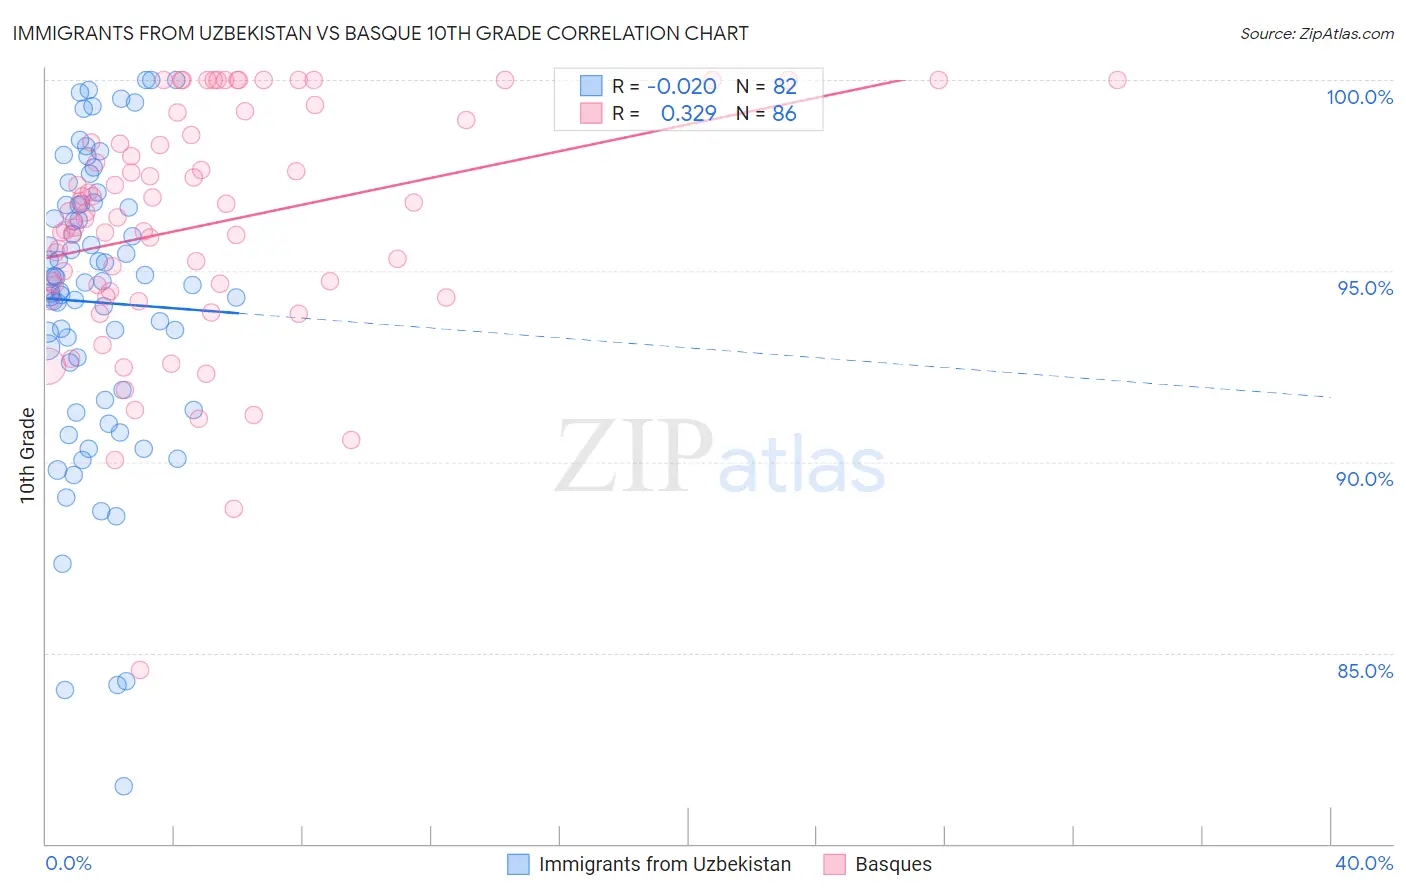
Immigrants from Uzbekistan vs Basque 10th Grade Correlation Chart
The statistical analysis conducted on geographies consisting of 118,684,730 people shows no correlation between the proportion of Immigrants from Uzbekistan and percentage of population with at least 10th grade education in the United States with a correlation coefficient (R) of -0.020 and weighted average of 92.6%. Similarly, the statistical analysis conducted on geographies consisting of 165,776,783 people shows a mild positive correlation between the proportion of Basques and percentage of population with at least 10th grade education in the United States with a correlation coefficient (R) of 0.329 and weighted average of 94.3%, a difference of 1.8%.
10th Grade Correlation Summary
| Measurement | Immigrants from Uzbekistan | Basque |
| Minimum | 81.5% | 84.6% |
| Maximum | 100.0% | 100.0% |
| Range | 18.5% | 15.4% |
| Mean | 94.2% | 96.2% |
| Median | 94.7% | 96.5% |
| Interquartile 25% (IQ1) | 91.9% | 94.5% |
| Interquartile 75% (IQ3) | 96.7% | 98.6% |
| Interquartile Range (IQR) | 4.8% | 4.1% |
| Standard Deviation (Sample) | 3.9% | 3.1% |
| Standard Deviation (Population) | 3.9% | 3.1% |
Similar Demographics by 10th Grade
Demographics Similar to Immigrants from Uzbekistan by 10th Grade
In terms of 10th grade, the demographic groups most similar to Immigrants from Uzbekistan are Immigrants from Jamaica (92.6%, a difference of 0.010%), Paiute (92.6%, a difference of 0.040%), Immigrants from Costa Rica (92.7%, a difference of 0.050%), Immigrants from South America (92.6%, a difference of 0.050%), and Apache (92.6%, a difference of 0.050%).
| Demographics | Rating | Rank | 10th Grade |
| Ghanaians | 0.9 /100 | #253 | Tragic 92.8% |
| Armenians | 0.9 /100 | #254 | Tragic 92.7% |
| Immigrants | Bolivia | 0.7 /100 | #255 | Tragic 92.7% |
| Immigrants | Nigeria | 0.7 /100 | #256 | Tragic 92.7% |
| U.S. Virgin Islanders | 0.7 /100 | #257 | Tragic 92.7% |
| Immigrants | Costa Rica | 0.6 /100 | #258 | Tragic 92.7% |
| Immigrants | Jamaica | 0.5 /100 | #259 | Tragic 92.6% |
| Immigrants | Uzbekistan | 0.5 /100 | #260 | Tragic 92.6% |
| Paiute | 0.4 /100 | #261 | Tragic 92.6% |
| Immigrants | South America | 0.4 /100 | #262 | Tragic 92.6% |
| Apache | 0.4 /100 | #263 | Tragic 92.6% |
| Peruvians | 0.4 /100 | #264 | Tragic 92.6% |
| Dutch West Indians | 0.4 /100 | #265 | Tragic 92.6% |
| Immigrants | Philippines | 0.4 /100 | #266 | Tragic 92.6% |
| Taiwanese | 0.3 /100 | #267 | Tragic 92.5% |
Demographics Similar to Basques by 10th Grade
In terms of 10th grade, the demographic groups most similar to Basques are Immigrants from Belarus (94.4%, a difference of 0.010%), Inupiat (94.4%, a difference of 0.010%), Cree (94.4%, a difference of 0.010%), Immigrants from Taiwan (94.4%, a difference of 0.020%), and American (94.3%, a difference of 0.020%).
| Demographics | Rating | Rank | 10th Grade |
| Immigrants | Hungary | 95.8 /100 | #117 | Exceptional 94.4% |
| Jordanians | 95.6 /100 | #118 | Exceptional 94.4% |
| Immigrants | Israel | 95.4 /100 | #119 | Exceptional 94.4% |
| Immigrants | Taiwan | 95.3 /100 | #120 | Exceptional 94.4% |
| Immigrants | Belarus | 95.2 /100 | #121 | Exceptional 94.4% |
| Inupiat | 95.1 /100 | #122 | Exceptional 94.4% |
| Cree | 95.1 /100 | #123 | Exceptional 94.4% |
| Basques | 94.9 /100 | #124 | Exceptional 94.3% |
| Americans | 94.4 /100 | #125 | Exceptional 94.3% |
| Immigrants | Iran | 94.4 /100 | #126 | Exceptional 94.3% |
| Israelis | 93.8 /100 | #127 | Exceptional 94.3% |
| Potawatomi | 93.6 /100 | #128 | Exceptional 94.3% |
| Iroquois | 92.8 /100 | #129 | Exceptional 94.3% |
| Immigrants | Greece | 92.7 /100 | #130 | Exceptional 94.3% |
| Immigrants | Eastern Europe | 92.5 /100 | #131 | Exceptional 94.3% |