Immigrants from Uruguay vs Iroquois Male Poverty
COMPARE
Immigrants from Uruguay
Iroquois
Male Poverty
Male Poverty Comparison
Immigrants from Uruguay
Iroquois
11.6%
MALE POVERTY
19.1/ 100
METRIC RATING
192nd/ 347
METRIC RANK
13.2%
MALE POVERTY
0.1/ 100
METRIC RATING
264th/ 347
METRIC RANK
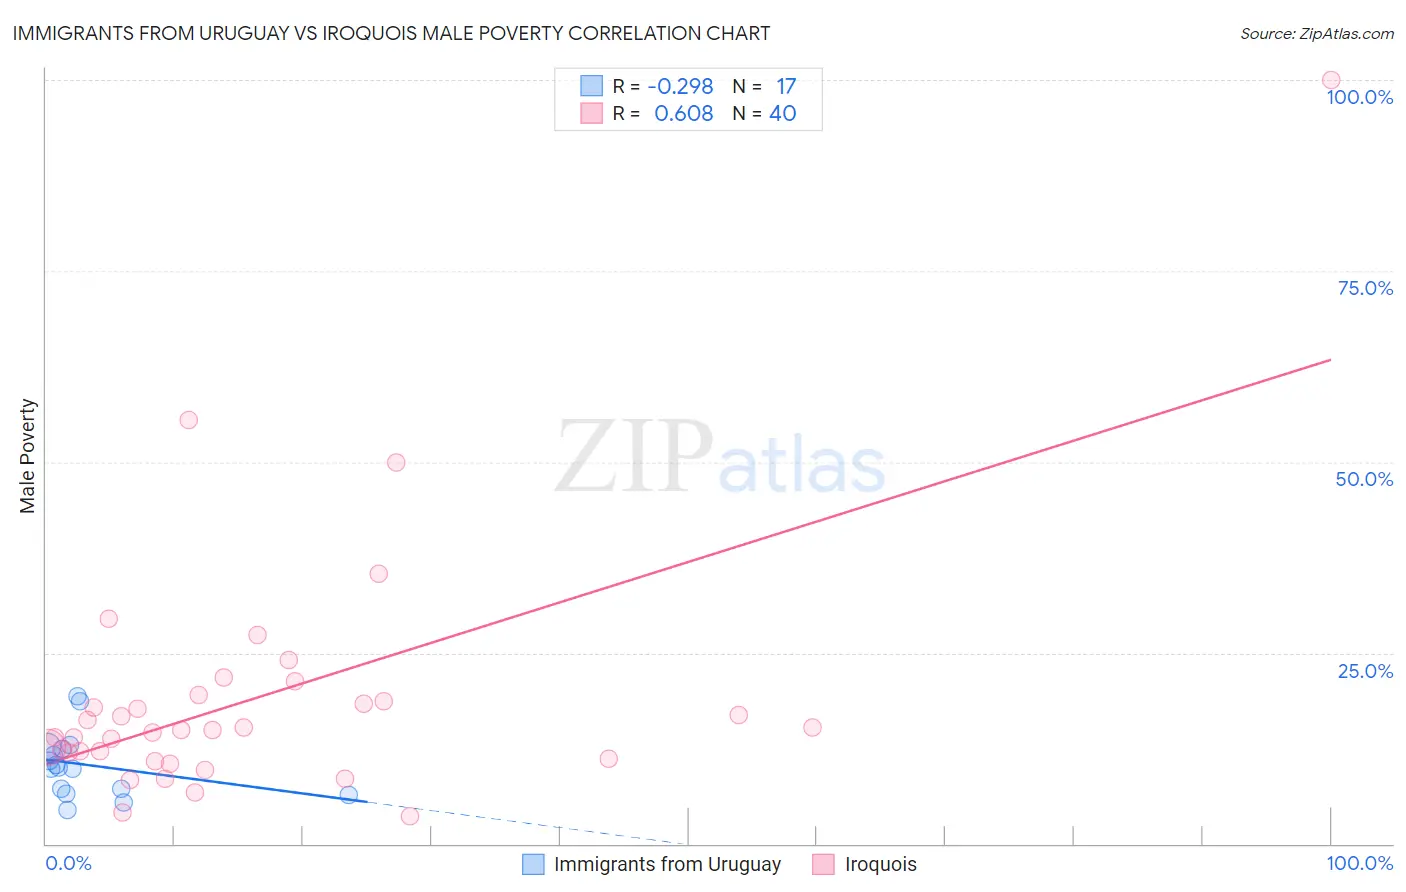
Immigrants from Uruguay vs Iroquois Male Poverty Correlation Chart
The statistical analysis conducted on geographies consisting of 133,238,599 people shows a weak negative correlation between the proportion of Immigrants from Uruguay and poverty level among males in the United States with a correlation coefficient (R) of -0.298 and weighted average of 11.6%. Similarly, the statistical analysis conducted on geographies consisting of 207,214,183 people shows a significant positive correlation between the proportion of Iroquois and poverty level among males in the United States with a correlation coefficient (R) of 0.608 and weighted average of 13.2%, a difference of 14.1%.
Male Poverty Correlation Summary
| Measurement | Immigrants from Uruguay | Iroquois |
| Minimum | 4.5% | 3.6% |
| Maximum | 19.3% | 100.0% |
| Range | 14.8% | 96.4% |
| Mean | 10.3% | 19.1% |
| Median | 10.0% | 14.9% |
| Interquartile 25% (IQ1) | 6.9% | 11.5% |
| Interquartile 75% (IQ3) | 12.6% | 19.1% |
| Interquartile Range (IQR) | 5.7% | 7.5% |
| Standard Deviation (Sample) | 4.1% | 16.8% |
| Standard Deviation (Population) | 4.0% | 16.6% |
Similar Demographics by Male Poverty
Demographics Similar to Immigrants from Uruguay by Male Poverty
In terms of male poverty, the demographic groups most similar to Immigrants from Uruguay are Immigrants from Kuwait (11.6%, a difference of 0.29%), Immigrants from Kenya (11.6%, a difference of 0.50%), South American Indian (11.5%, a difference of 0.52%), Arab (11.6%, a difference of 0.55%), and Hmong (11.6%, a difference of 0.56%).
| Demographics | Rating | Rank | Male Poverty |
| Immigrants | Afghanistan | 33.3 /100 | #185 | Fair 11.4% |
| Immigrants | Sierra Leone | 32.9 /100 | #186 | Fair 11.4% |
| Immigrants | Iraq | 31.9 /100 | #187 | Fair 11.4% |
| Sierra Leoneans | 29.9 /100 | #188 | Fair 11.4% |
| Hawaiians | 28.3 /100 | #189 | Fair 11.4% |
| Israelis | 26.1 /100 | #190 | Fair 11.5% |
| South American Indians | 22.8 /100 | #191 | Fair 11.5% |
| Immigrants | Uruguay | 19.1 /100 | #192 | Poor 11.6% |
| Immigrants | Kuwait | 17.3 /100 | #193 | Poor 11.6% |
| Immigrants | Kenya | 16.1 /100 | #194 | Poor 11.6% |
| Arabs | 15.8 /100 | #195 | Poor 11.6% |
| Hmong | 15.8 /100 | #196 | Poor 11.6% |
| Delaware | 15.4 /100 | #197 | Poor 11.7% |
| Iraqis | 14.7 /100 | #198 | Poor 11.7% |
| Spanish | 14.1 /100 | #199 | Poor 11.7% |
Demographics Similar to Iroquois by Male Poverty
In terms of male poverty, the demographic groups most similar to Iroquois are Jamaican (13.2%, a difference of 0.020%), Immigrants from Guyana (13.2%, a difference of 0.16%), Immigrants from Jamaica (13.3%, a difference of 0.28%), Subsaharan African (13.3%, a difference of 0.30%), and Central American (13.2%, a difference of 0.36%).
| Demographics | Rating | Rank | Male Poverty |
| Immigrants | Trinidad and Tobago | 0.1 /100 | #257 | Tragic 13.1% |
| Cape Verdeans | 0.1 /100 | #258 | Tragic 13.1% |
| Cherokee | 0.1 /100 | #259 | Tragic 13.1% |
| Ottawa | 0.1 /100 | #260 | Tragic 13.1% |
| Trinidadians and Tobagonians | 0.1 /100 | #261 | Tragic 13.1% |
| Spanish American Indians | 0.1 /100 | #262 | Tragic 13.1% |
| Central Americans | 0.1 /100 | #263 | Tragic 13.2% |
| Iroquois | 0.1 /100 | #264 | Tragic 13.2% |
| Jamaicans | 0.1 /100 | #265 | Tragic 13.2% |
| Immigrants | Guyana | 0.1 /100 | #266 | Tragic 13.2% |
| Immigrants | Jamaica | 0.1 /100 | #267 | Tragic 13.3% |
| Sub-Saharan Africans | 0.1 /100 | #268 | Tragic 13.3% |
| Guyanese | 0.0 /100 | #269 | Tragic 13.3% |
| Cree | 0.0 /100 | #270 | Tragic 13.3% |
| Spanish Americans | 0.0 /100 | #271 | Tragic 13.4% |