Immigrants from Uruguay vs Immigrants from Eastern Africa Male Poverty
COMPARE
Immigrants from Uruguay
Immigrants from Eastern Africa
Male Poverty
Male Poverty Comparison
Immigrants from Uruguay
Immigrants from Eastern Africa
11.6%
MALE POVERTY
19.1/ 100
METRIC RATING
192nd/ 347
METRIC RANK
12.0%
MALE POVERTY
5.4/ 100
METRIC RATING
206th/ 347
METRIC RANK
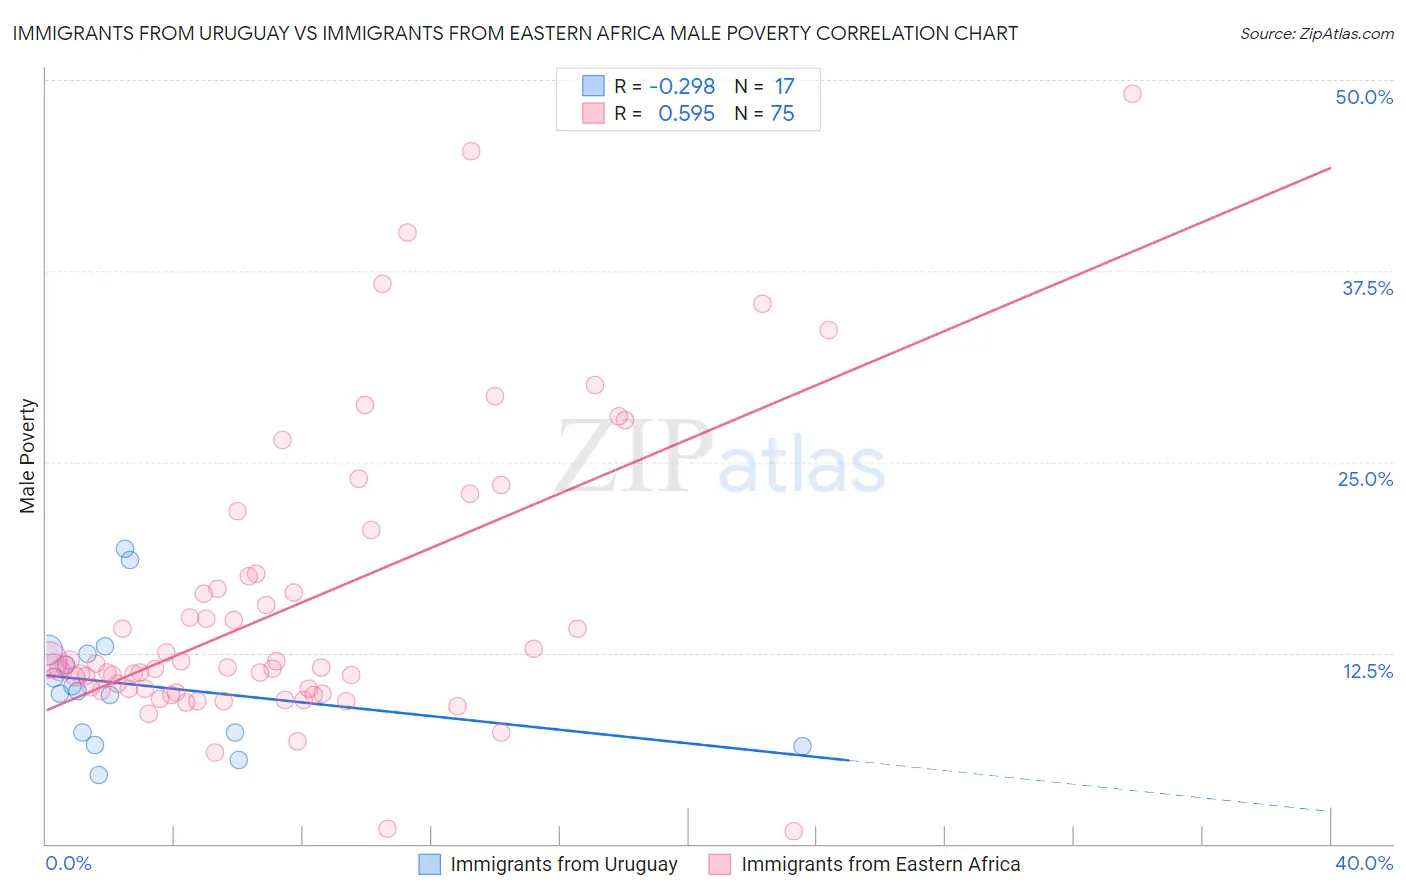
Immigrants from Uruguay vs Immigrants from Eastern Africa Male Poverty Correlation Chart
The statistical analysis conducted on geographies consisting of 133,238,599 people shows a weak negative correlation between the proportion of Immigrants from Uruguay and poverty level among males in the United States with a correlation coefficient (R) of -0.298 and weighted average of 11.6%. Similarly, the statistical analysis conducted on geographies consisting of 354,832,028 people shows a substantial positive correlation between the proportion of Immigrants from Eastern Africa and poverty level among males in the United States with a correlation coefficient (R) of 0.595 and weighted average of 12.0%, a difference of 3.4%.
Male Poverty Correlation Summary
| Measurement | Immigrants from Uruguay | Immigrants from Eastern Africa |
| Minimum | 4.5% | 0.81% |
| Maximum | 19.3% | 49.1% |
| Range | 14.8% | 48.3% |
| Mean | 10.3% | 15.6% |
| Median | 10.0% | 11.5% |
| Interquartile 25% (IQ1) | 6.9% | 10.0% |
| Interquartile 75% (IQ3) | 12.6% | 17.5% |
| Interquartile Range (IQR) | 5.7% | 7.5% |
| Standard Deviation (Sample) | 4.1% | 9.5% |
| Standard Deviation (Population) | 4.0% | 9.5% |
Demographics Similar to Immigrants from Uruguay and Immigrants from Eastern Africa by Male Poverty
In terms of male poverty, the demographic groups most similar to Immigrants from Uruguay are Immigrants from Kuwait (11.6%, a difference of 0.29%), Immigrants from Kenya (11.6%, a difference of 0.50%), South American Indian (11.5%, a difference of 0.52%), Arab (11.6%, a difference of 0.55%), and Hmong (11.6%, a difference of 0.56%). Similarly, the demographic groups most similar to Immigrants from Eastern Africa are Malaysian (12.0%, a difference of 0.10%), Panamanian (11.9%, a difference of 0.35%), Immigrants (12.0%, a difference of 0.43%), Immigrants from the Azores (12.0%, a difference of 0.54%), and Immigrants from Uganda (11.8%, a difference of 1.1%).
| Demographics | Rating | Rank | Male Poverty |
| Hawaiians | 28.3 /100 | #189 | Fair 11.4% |
| Israelis | 26.1 /100 | #190 | Fair 11.5% |
| South American Indians | 22.8 /100 | #191 | Fair 11.5% |
| Immigrants | Uruguay | 19.1 /100 | #192 | Poor 11.6% |
| Immigrants | Kuwait | 17.3 /100 | #193 | Poor 11.6% |
| Immigrants | Kenya | 16.1 /100 | #194 | Poor 11.6% |
| Arabs | 15.8 /100 | #195 | Poor 11.6% |
| Hmong | 15.8 /100 | #196 | Poor 11.6% |
| Delaware | 15.4 /100 | #197 | Poor 11.7% |
| Iraqis | 14.7 /100 | #198 | Poor 11.7% |
| Spanish | 14.1 /100 | #199 | Poor 11.7% |
| Immigrants | Lebanon | 13.6 /100 | #200 | Poor 11.7% |
| Spaniards | 13.5 /100 | #201 | Poor 11.7% |
| Aleuts | 10.4 /100 | #202 | Poor 11.8% |
| Immigrants | Western Asia | 9.8 /100 | #203 | Tragic 11.8% |
| Immigrants | Uganda | 8.5 /100 | #204 | Tragic 11.8% |
| Panamanians | 6.2 /100 | #205 | Tragic 11.9% |
| Immigrants | Eastern Africa | 5.4 /100 | #206 | Tragic 12.0% |
| Malaysians | 5.2 /100 | #207 | Tragic 12.0% |
| Immigrants | Immigrants | 4.5 /100 | #208 | Tragic 12.0% |
| Immigrants | Azores | 4.3 /100 | #209 | Tragic 12.0% |