Immigrants from Uruguay vs Japanese Disability Age Over 75
COMPARE
Immigrants from Uruguay
Japanese
Disability Age Over 75
Disability Age Over 75 Comparison
Immigrants from Uruguay
Japanese
46.4%
DISABILITY AGE OVER 75
96.7/ 100
METRIC RATING
107th/ 347
METRIC RANK
50.2%
DISABILITY AGE OVER 75
0.0/ 100
METRIC RATING
303rd/ 347
METRIC RANK
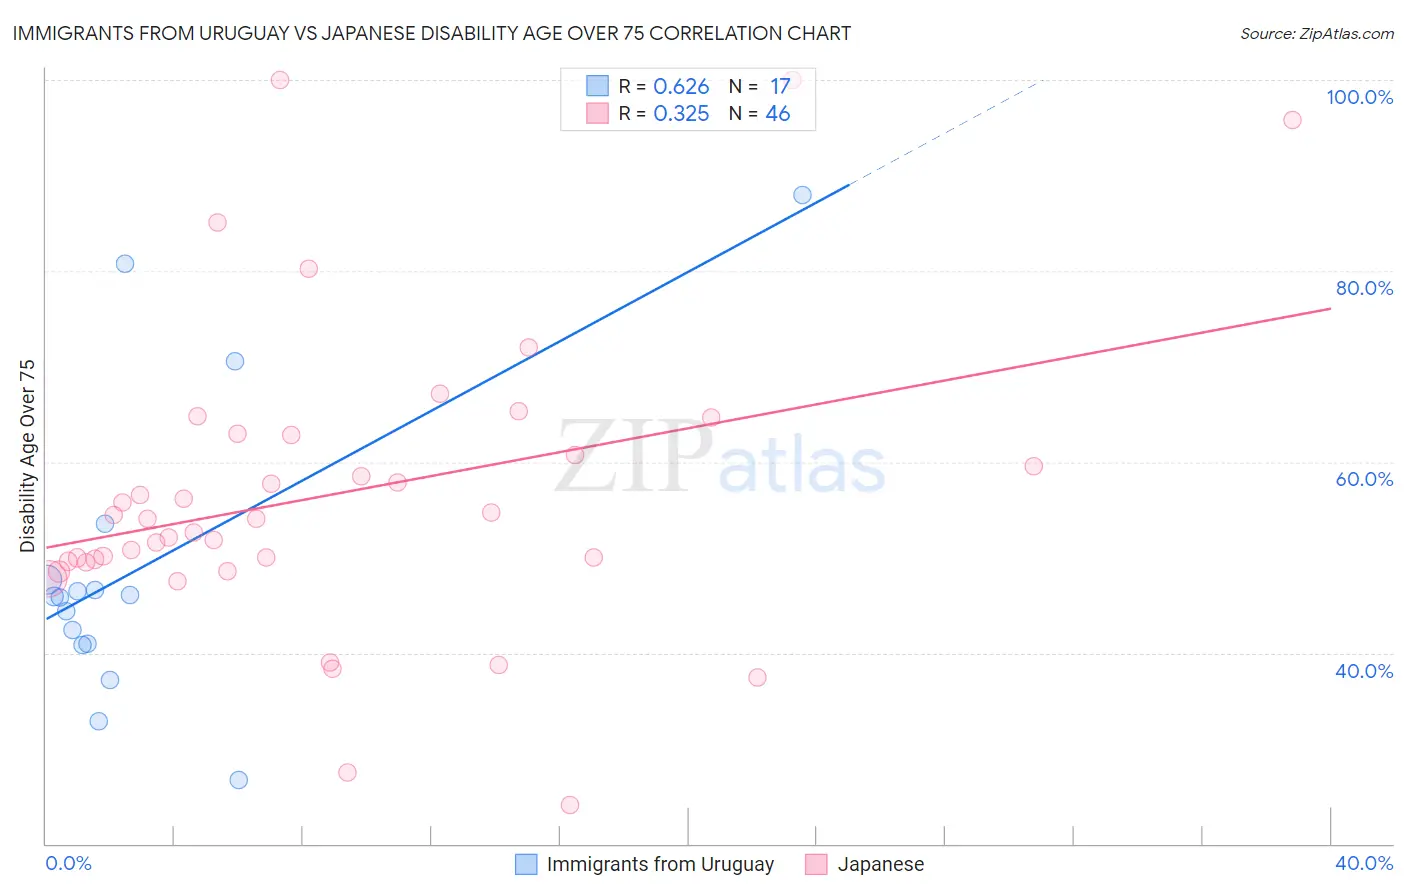
Immigrants from Uruguay vs Japanese Disability Age Over 75 Correlation Chart
The statistical analysis conducted on geographies consisting of 133,242,093 people shows a significant positive correlation between the proportion of Immigrants from Uruguay and percentage of population with a disability over the age of 75 in the United States with a correlation coefficient (R) of 0.626 and weighted average of 46.4%. Similarly, the statistical analysis conducted on geographies consisting of 248,861,887 people shows a mild positive correlation between the proportion of Japanese and percentage of population with a disability over the age of 75 in the United States with a correlation coefficient (R) of 0.325 and weighted average of 50.2%, a difference of 8.2%.
Disability Age Over 75 Correlation Summary
| Measurement | Immigrants from Uruguay | Japanese |
| Minimum | 26.7% | 24.0% |
| Maximum | 88.0% | 100.0% |
| Range | 61.3% | 76.0% |
| Mean | 49.2% | 56.6% |
| Median | 45.9% | 54.0% |
| Interquartile 25% (IQ1) | 40.9% | 49.6% |
| Interquartile 75% (IQ3) | 50.6% | 62.8% |
| Interquartile Range (IQR) | 9.7% | 13.3% |
| Standard Deviation (Sample) | 16.1% | 15.9% |
| Standard Deviation (Population) | 15.6% | 15.7% |
Similar Demographics by Disability Age Over 75
Demographics Similar to Immigrants from Uruguay by Disability Age Over 75
In terms of disability age over 75, the demographic groups most similar to Immigrants from Uruguay are Brazilian (46.5%, a difference of 0.010%), Immigrants from Kuwait (46.4%, a difference of 0.030%), Chilean (46.5%, a difference of 0.040%), Immigrants from Cameroon (46.4%, a difference of 0.050%), and Immigrants from Hong Kong (46.5%, a difference of 0.050%).
| Demographics | Rating | Rank | Disability Age Over 75 |
| Immigrants | Eastern Europe | 97.7 /100 | #100 | Exceptional 46.3% |
| Mongolians | 97.7 /100 | #101 | Exceptional 46.3% |
| Immigrants | Malaysia | 97.1 /100 | #102 | Exceptional 46.4% |
| Ukrainians | 97.1 /100 | #103 | Exceptional 46.4% |
| Israelis | 97.0 /100 | #104 | Exceptional 46.4% |
| Immigrants | Cameroon | 96.9 /100 | #105 | Exceptional 46.4% |
| Immigrants | Kuwait | 96.8 /100 | #106 | Exceptional 46.4% |
| Immigrants | Uruguay | 96.7 /100 | #107 | Exceptional 46.4% |
| Brazilians | 96.6 /100 | #108 | Exceptional 46.5% |
| Chileans | 96.4 /100 | #109 | Exceptional 46.5% |
| Immigrants | Hong Kong | 96.4 /100 | #110 | Exceptional 46.5% |
| Immigrants | Chile | 96.4 /100 | #111 | Exceptional 46.5% |
| Immigrants | Pakistan | 96.1 /100 | #112 | Exceptional 46.5% |
| Irish | 96.0 /100 | #113 | Exceptional 46.5% |
| Dutch | 95.9 /100 | #114 | Exceptional 46.5% |
Demographics Similar to Japanese by Disability Age Over 75
In terms of disability age over 75, the demographic groups most similar to Japanese are Cherokee (50.2%, a difference of 0.010%), Immigrants from Dominican Republic (50.3%, a difference of 0.11%), Dominican (50.2%, a difference of 0.17%), Cape Verdean (50.1%, a difference of 0.23%), and Immigrants from Micronesia (50.1%, a difference of 0.26%).
| Demographics | Rating | Rank | Disability Age Over 75 |
| Mexican American Indians | 0.0 /100 | #296 | Tragic 50.0% |
| Armenians | 0.0 /100 | #297 | Tragic 50.0% |
| Marshallese | 0.0 /100 | #298 | Tragic 50.1% |
| Immigrants | Micronesia | 0.0 /100 | #299 | Tragic 50.1% |
| Cape Verdeans | 0.0 /100 | #300 | Tragic 50.1% |
| Dominicans | 0.0 /100 | #301 | Tragic 50.2% |
| Cherokee | 0.0 /100 | #302 | Tragic 50.2% |
| Japanese | 0.0 /100 | #303 | Tragic 50.2% |
| Immigrants | Dominican Republic | 0.0 /100 | #304 | Tragic 50.3% |
| Central American Indians | 0.0 /100 | #305 | Tragic 50.5% |
| Immigrants | Central America | 0.0 /100 | #306 | Tragic 50.5% |
| Immigrants | Fiji | 0.0 /100 | #307 | Tragic 50.6% |
| Hispanics or Latinos | 0.0 /100 | #308 | Tragic 50.6% |
| Aleuts | 0.0 /100 | #309 | Tragic 50.6% |
| Tlingit-Haida | 0.0 /100 | #310 | Tragic 50.6% |