Immigrants from Uruguay vs Japanese Median Female Earnings
COMPARE
Immigrants from Uruguay
Japanese
Median Female Earnings
Median Female Earnings Comparison
Immigrants from Uruguay
Japanese
$38,945
MEDIAN FEMALE EARNINGS
17.3/ 100
METRIC RATING
204th/ 347
METRIC RANK
$38,528
MEDIAN FEMALE EARNINGS
8.1/ 100
METRIC RATING
222nd/ 347
METRIC RANK
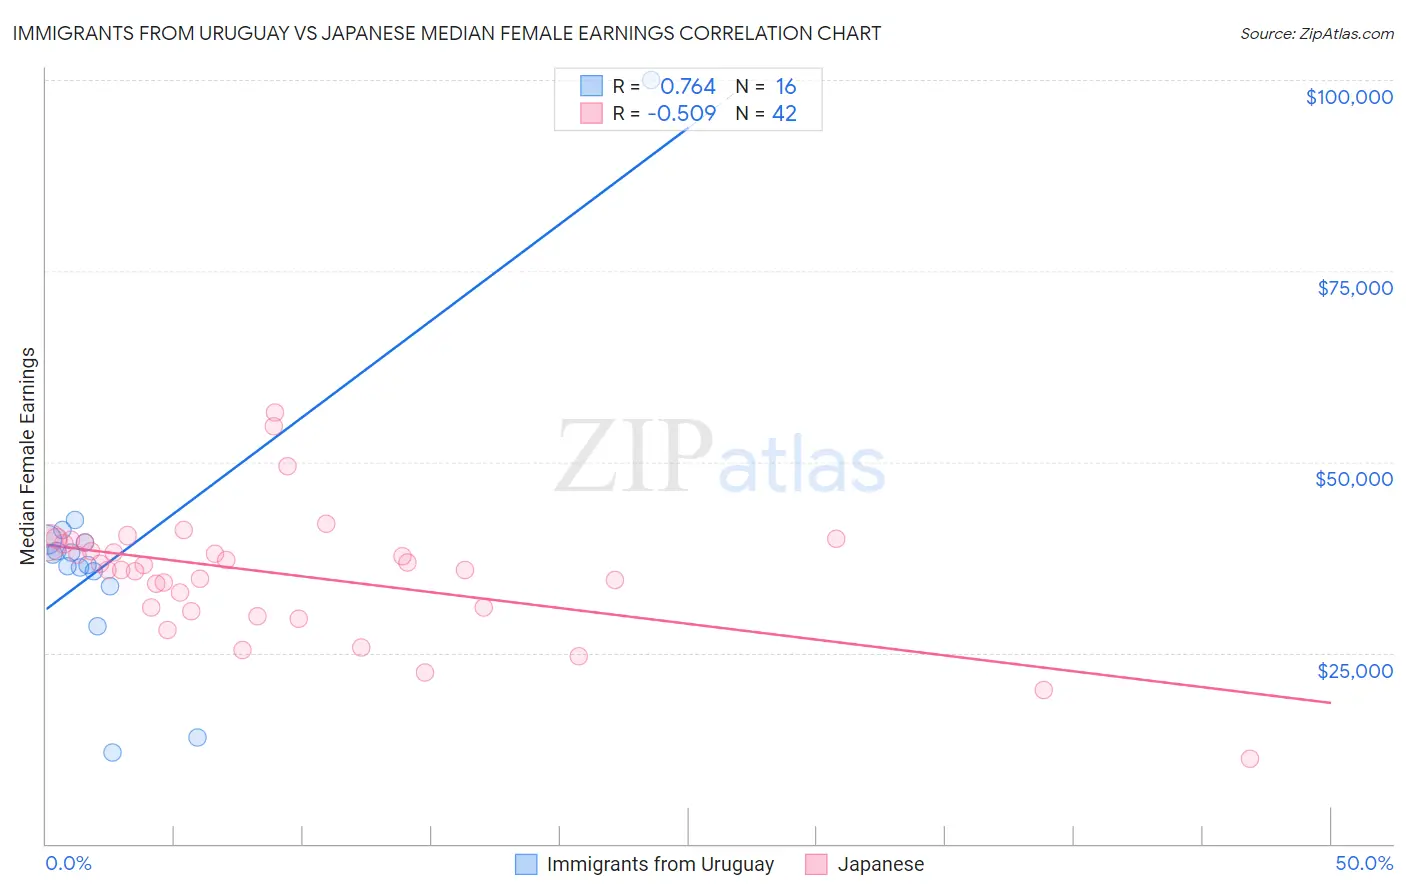
Immigrants from Uruguay vs Japanese Median Female Earnings Correlation Chart
The statistical analysis conducted on geographies consisting of 133,253,998 people shows a strong positive correlation between the proportion of Immigrants from Uruguay and median female earnings in the United States with a correlation coefficient (R) of 0.764 and weighted average of $38,945. Similarly, the statistical analysis conducted on geographies consisting of 249,158,779 people shows a substantial negative correlation between the proportion of Japanese and median female earnings in the United States with a correlation coefficient (R) of -0.509 and weighted average of $38,528, a difference of 1.1%.
Median Female Earnings Correlation Summary
| Measurement | Immigrants from Uruguay | Japanese |
| Minimum | $12,017 | $11,066 |
| Maximum | $100,000 | $56,543 |
| Range | $87,983 | $45,477 |
| Mean | $38,117 | $35,269 |
| Median | $37,217 | $36,190 |
| Interquartile 25% (IQ1) | $34,685 | $30,918 |
| Interquartile 75% (IQ3) | $39,605 | $39,451 |
| Interquartile Range (IQR) | $4,920 | $8,533 |
| Standard Deviation (Sample) | $18,714 | $8,213 |
| Standard Deviation (Population) | $18,119 | $8,115 |
Demographics Similar to Immigrants from Uruguay and Japanese by Median Female Earnings
In terms of median female earnings, the demographic groups most similar to Immigrants from Uruguay are Immigrants from Colombia ($38,913, a difference of 0.080%), Czech ($38,992, a difference of 0.12%), Immigrants from Bosnia and Herzegovina ($38,886, a difference of 0.15%), Immigrants from Cambodia ($38,833, a difference of 0.29%), and Immigrants from Thailand ($38,810, a difference of 0.35%). Similarly, the demographic groups most similar to Japanese are Immigrants from Sudan ($38,511, a difference of 0.040%), Yugoslavian ($38,573, a difference of 0.12%), Immigrants from the Azores ($38,573, a difference of 0.12%), Nepalese ($38,603, a difference of 0.19%), and Cape Verdean ($38,614, a difference of 0.22%).
| Demographics | Rating | Rank | Median Female Earnings |
| Czechs | 18.7 /100 | #203 | Poor $38,992 |
| Immigrants | Uruguay | 17.3 /100 | #204 | Poor $38,945 |
| Immigrants | Colombia | 16.3 /100 | #205 | Poor $38,913 |
| Immigrants | Bosnia and Herzegovina | 15.6 /100 | #206 | Poor $38,886 |
| Immigrants | Cambodia | 14.2 /100 | #207 | Poor $38,833 |
| Immigrants | Thailand | 13.6 /100 | #208 | Poor $38,810 |
| Norwegians | 13.4 /100 | #209 | Poor $38,802 |
| Czechoslovakians | 12.0 /100 | #210 | Poor $38,738 |
| Aleuts | 11.6 /100 | #211 | Poor $38,719 |
| Guamanians/Chamorros | 11.5 /100 | #212 | Poor $38,717 |
| Jamaicans | 10.5 /100 | #213 | Poor $38,670 |
| Iraqis | 10.5 /100 | #214 | Poor $38,666 |
| Spaniards | 10.3 /100 | #215 | Poor $38,656 |
| Immigrants | Ecuador | 10.1 /100 | #216 | Poor $38,644 |
| Immigrants | Jamaica | 9.7 /100 | #217 | Tragic $38,625 |
| Cape Verdeans | 9.5 /100 | #218 | Tragic $38,614 |
| Nepalese | 9.3 /100 | #219 | Tragic $38,603 |
| Yugoslavians | 8.8 /100 | #220 | Tragic $38,573 |
| Immigrants | Azores | 8.8 /100 | #221 | Tragic $38,573 |
| Japanese | 8.1 /100 | #222 | Tragic $38,528 |
| Immigrants | Sudan | 7.8 /100 | #223 | Tragic $38,511 |