Immigrants from Uruguay vs Ghanaian 1 or more Vehicles in Household
COMPARE
Immigrants from Uruguay
Ghanaian
1 or more Vehicles in Household
1 or more Vehicles in Household Comparison
Immigrants from Uruguay
Ghanaians
88.1%
1 OR MORE VEHICLES IN HOUSEHOLD
1.1/ 100
METRIC RATING
252nd/ 347
METRIC RANK
83.6%
1 OR MORE VEHICLES IN HOUSEHOLD
0.0/ 100
METRIC RATING
317th/ 347
METRIC RANK
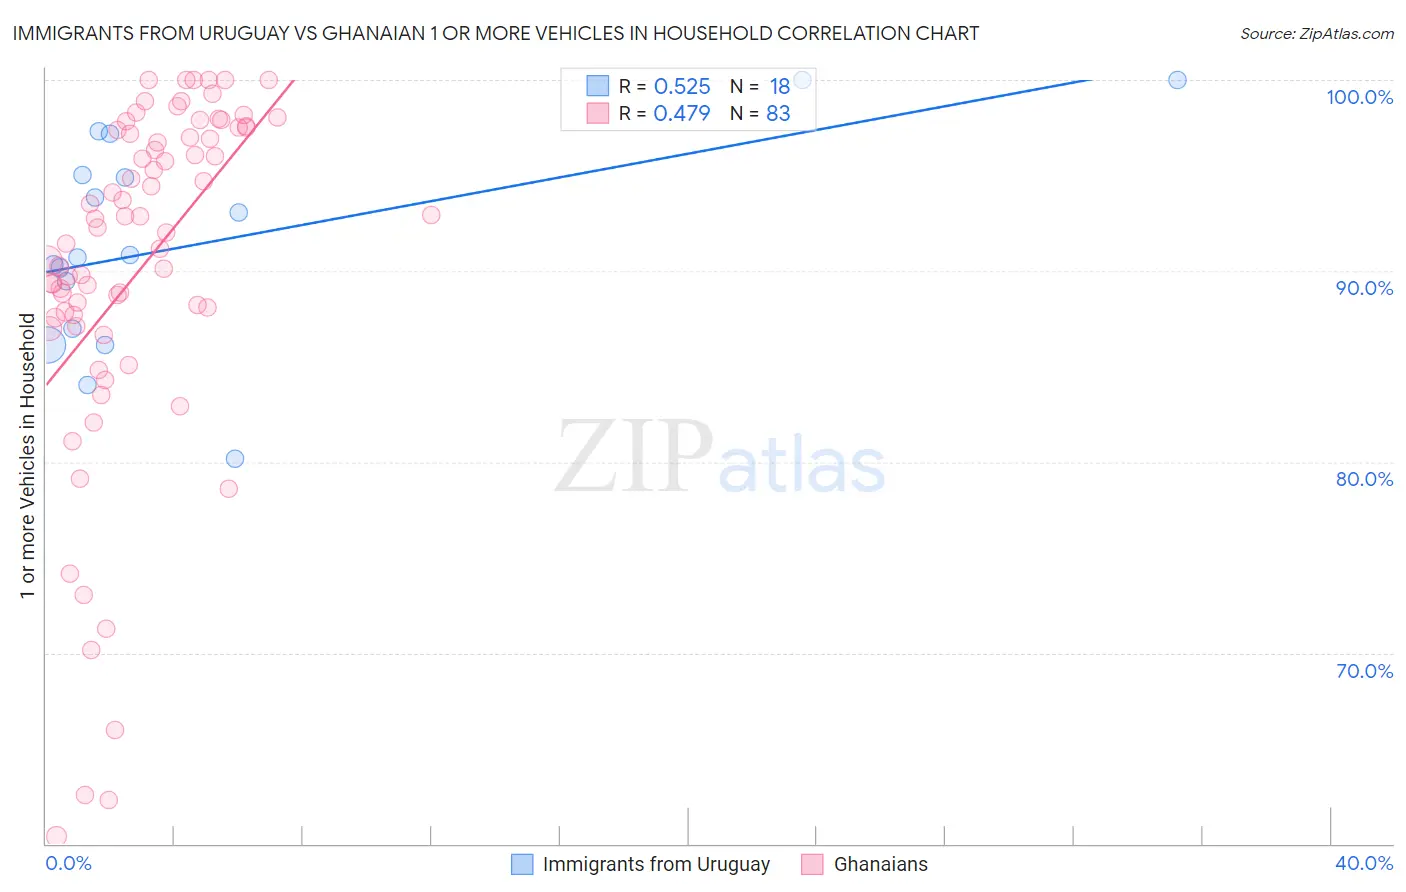
Immigrants from Uruguay vs Ghanaian 1 or more Vehicles in Household Correlation Chart
The statistical analysis conducted on geographies consisting of 133,245,142 people shows a substantial positive correlation between the proportion of Immigrants from Uruguay and percentage of households with 1 or more vehicles available in the United States with a correlation coefficient (R) of 0.525 and weighted average of 88.1%. Similarly, the statistical analysis conducted on geographies consisting of 190,247,159 people shows a moderate positive correlation between the proportion of Ghanaians and percentage of households with 1 or more vehicles available in the United States with a correlation coefficient (R) of 0.479 and weighted average of 83.6%, a difference of 5.4%.
1 or more Vehicles in Household Correlation Summary
| Measurement | Immigrants from Uruguay | Ghanaian |
| Minimum | 80.2% | 60.4% |
| Maximum | 100.0% | 100.0% |
| Range | 19.8% | 39.6% |
| Mean | 91.5% | 90.1% |
| Median | 90.8% | 92.3% |
| Interquartile 25% (IQ1) | 87.0% | 87.6% |
| Interquartile 75% (IQ3) | 95.0% | 97.4% |
| Interquartile Range (IQR) | 8.1% | 9.8% |
| Standard Deviation (Sample) | 5.5% | 9.3% |
| Standard Deviation (Population) | 5.3% | 9.2% |
Similar Demographics by 1 or more Vehicles in Household
Demographics Similar to Immigrants from Uruguay by 1 or more Vehicles in Household
In terms of 1 or more vehicles in household, the demographic groups most similar to Immigrants from Uruguay are Honduran (88.1%, a difference of 0.030%), Haitian (88.1%, a difference of 0.040%), Immigrants from Serbia (88.2%, a difference of 0.050%), Egyptian (88.2%, a difference of 0.060%), and Immigrants from Latvia (88.1%, a difference of 0.060%).
| Demographics | Rating | Rank | 1 or more Vehicles in Household |
| Immigrants | Czechoslovakia | 1.9 /100 | #245 | Tragic 88.3% |
| Menominee | 1.9 /100 | #246 | Tragic 88.3% |
| Immigrants | Honduras | 1.7 /100 | #247 | Tragic 88.3% |
| Immigrants | Nigeria | 1.5 /100 | #248 | Tragic 88.2% |
| Blacks/African Americans | 1.4 /100 | #249 | Tragic 88.2% |
| Egyptians | 1.2 /100 | #250 | Tragic 88.2% |
| Immigrants | Serbia | 1.2 /100 | #251 | Tragic 88.2% |
| Immigrants | Uruguay | 1.1 /100 | #252 | Tragic 88.1% |
| Hondurans | 1.0 /100 | #253 | Tragic 88.1% |
| Haitians | 0.9 /100 | #254 | Tragic 88.1% |
| Immigrants | Latvia | 0.9 /100 | #255 | Tragic 88.1% |
| Colombians | 0.9 /100 | #256 | Tragic 88.0% |
| Liberians | 0.9 /100 | #257 | Tragic 88.0% |
| South American Indians | 0.9 /100 | #258 | Tragic 88.0% |
| Nigerians | 0.8 /100 | #259 | Tragic 88.0% |
Demographics Similar to Ghanaians by 1 or more Vehicles in Household
In terms of 1 or more vehicles in household, the demographic groups most similar to Ghanaians are Immigrants from Ghana (83.4%, a difference of 0.20%), Alaska Native (83.8%, a difference of 0.22%), Immigrants from Belarus (83.3%, a difference of 0.34%), Cypriot (84.4%, a difference of 0.91%), and Albanian (84.4%, a difference of 0.98%).
| Demographics | Rating | Rank | 1 or more Vehicles in Household |
| U.S. Virgin Islanders | 0.0 /100 | #310 | Tragic 84.6% |
| Puerto Ricans | 0.0 /100 | #311 | Tragic 84.6% |
| Cape Verdeans | 0.0 /100 | #312 | Tragic 84.5% |
| Immigrants | Israel | 0.0 /100 | #313 | Tragic 84.5% |
| Albanians | 0.0 /100 | #314 | Tragic 84.4% |
| Cypriots | 0.0 /100 | #315 | Tragic 84.4% |
| Alaska Natives | 0.0 /100 | #316 | Tragic 83.8% |
| Ghanaians | 0.0 /100 | #317 | Tragic 83.6% |
| Immigrants | Ghana | 0.0 /100 | #318 | Tragic 83.4% |
| Immigrants | Belarus | 0.0 /100 | #319 | Tragic 83.3% |
| Soviet Union | 0.0 /100 | #320 | Tragic 82.7% |
| Jamaicans | 0.0 /100 | #321 | Tragic 82.1% |
| Immigrants | Cabo Verde | 0.0 /100 | #322 | Tragic 81.6% |
| Immigrants | Yemen | 0.0 /100 | #323 | Tragic 80.5% |
| Immigrants | Caribbean | 0.0 /100 | #324 | Tragic 80.4% |