Immigrants from Ukraine vs Immigrants from Southern Europe Male Poverty
COMPARE
Immigrants from Ukraine
Immigrants from Southern Europe
Male Poverty
Male Poverty Comparison
Immigrants from Ukraine
Immigrants from Southern Europe
10.7%
MALE POVERTY
84.3/ 100
METRIC RATING
126th/ 347
METRIC RANK
10.5%
MALE POVERTY
91.3/ 100
METRIC RATING
106th/ 347
METRIC RANK
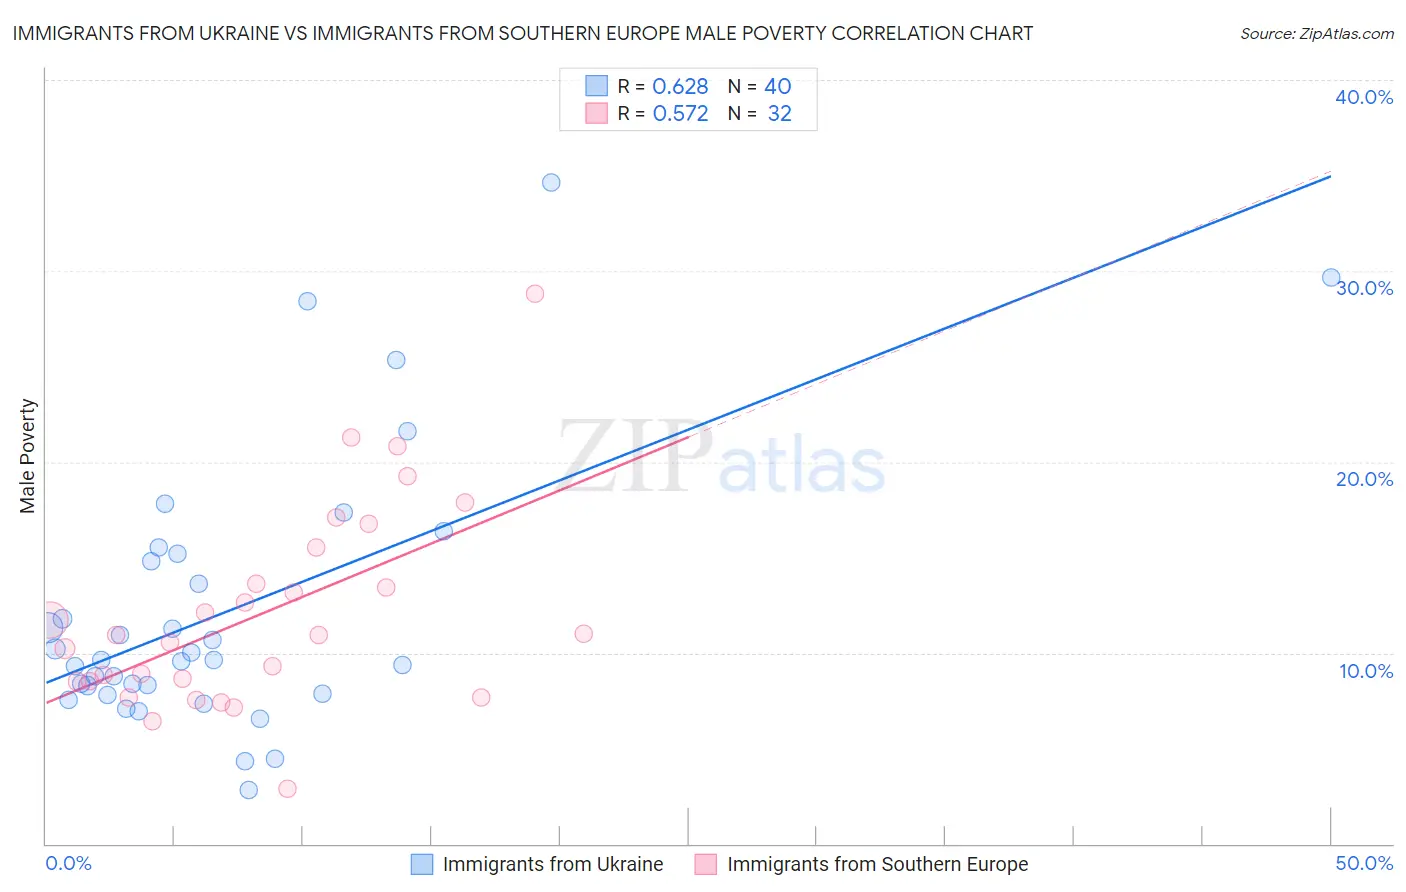
Immigrants from Ukraine vs Immigrants from Southern Europe Male Poverty Correlation Chart
The statistical analysis conducted on geographies consisting of 289,574,436 people shows a significant positive correlation between the proportion of Immigrants from Ukraine and poverty level among males in the United States with a correlation coefficient (R) of 0.628 and weighted average of 10.7%. Similarly, the statistical analysis conducted on geographies consisting of 402,406,508 people shows a substantial positive correlation between the proportion of Immigrants from Southern Europe and poverty level among males in the United States with a correlation coefficient (R) of 0.572 and weighted average of 10.5%, a difference of 1.7%.
Male Poverty Correlation Summary
| Measurement | Immigrants from Ukraine | Immigrants from Southern Europe |
| Minimum | 2.8% | 2.9% |
| Maximum | 34.6% | 28.8% |
| Range | 31.8% | 25.9% |
| Mean | 12.2% | 12.1% |
| Median | 9.6% | 10.9% |
| Interquartile 25% (IQ1) | 8.1% | 8.5% |
| Interquartile 75% (IQ3) | 15.0% | 14.6% |
| Interquartile Range (IQR) | 6.9% | 6.1% |
| Standard Deviation (Sample) | 7.1% | 5.4% |
| Standard Deviation (Population) | 7.0% | 5.3% |
Demographics Similar to Immigrants from Ukraine and Immigrants from Southern Europe by Male Poverty
In terms of male poverty, the demographic groups most similar to Immigrants from Ukraine are Immigrants from Norway (10.7%, a difference of 0.35%), French (10.7%, a difference of 0.50%), South African (10.7%, a difference of 0.53%), Native Hawaiian (10.7%, a difference of 0.57%), and Peruvian (10.7%, a difference of 0.59%). Similarly, the demographic groups most similar to Immigrants from Southern Europe are Laotian (10.5%, a difference of 0.010%), Portuguese (10.6%, a difference of 0.080%), Albanian (10.6%, a difference of 0.21%), Argentinean (10.6%, a difference of 0.35%), and Immigrants from Argentina (10.6%, a difference of 0.46%).
| Demographics | Rating | Rank | Male Poverty |
| Immigrants | Southern Europe | 91.3 /100 | #106 | Exceptional 10.5% |
| Laotians | 91.2 /100 | #107 | Exceptional 10.5% |
| Portuguese | 91.0 /100 | #108 | Exceptional 10.6% |
| Albanians | 90.6 /100 | #109 | Exceptional 10.6% |
| Argentineans | 90.1 /100 | #110 | Exceptional 10.6% |
| Immigrants | Argentina | 89.8 /100 | #111 | Excellent 10.6% |
| Immigrants | Turkey | 89.5 /100 | #112 | Excellent 10.6% |
| Palestinians | 89.1 /100 | #113 | Excellent 10.6% |
| Immigrants | Brazil | 89.0 /100 | #114 | Excellent 10.6% |
| Immigrants | Russia | 88.6 /100 | #115 | Excellent 10.6% |
| Sri Lankans | 88.1 /100 | #116 | Excellent 10.6% |
| Immigrants | South Eastern Asia | 88.1 /100 | #117 | Excellent 10.6% |
| Okinawans | 87.6 /100 | #118 | Excellent 10.7% |
| Immigrants | Hungary | 87.6 /100 | #119 | Excellent 10.7% |
| Immigrants | China | 87.1 /100 | #120 | Excellent 10.7% |
| Peruvians | 87.1 /100 | #121 | Excellent 10.7% |
| Native Hawaiians | 87.0 /100 | #122 | Excellent 10.7% |
| South Africans | 86.8 /100 | #123 | Excellent 10.7% |
| French | 86.7 /100 | #124 | Excellent 10.7% |
| Immigrants | Norway | 86.0 /100 | #125 | Excellent 10.7% |
| Immigrants | Ukraine | 84.3 /100 | #126 | Excellent 10.7% |