Immigrants from Ukraine vs Cambodian Male Poverty
COMPARE
Immigrants from Ukraine
Cambodian
Male Poverty
Male Poverty Comparison
Immigrants from Ukraine
Cambodians
10.7%
MALE POVERTY
84.3/ 100
METRIC RATING
126th/ 347
METRIC RANK
10.4%
MALE POVERTY
95.0/ 100
METRIC RATING
88th/ 347
METRIC RANK
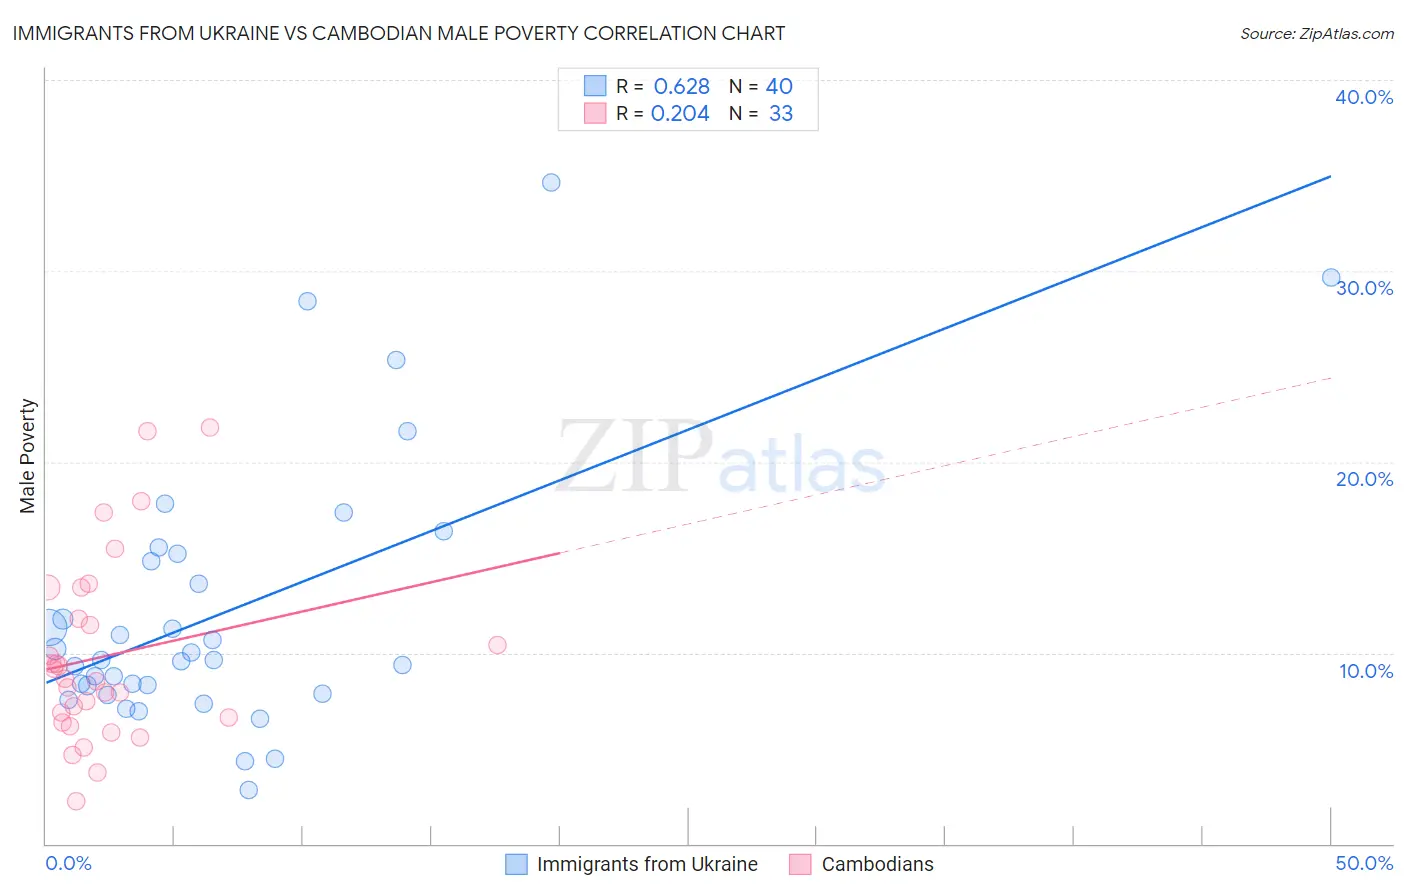
Immigrants from Ukraine vs Cambodian Male Poverty Correlation Chart
The statistical analysis conducted on geographies consisting of 289,574,436 people shows a significant positive correlation between the proportion of Immigrants from Ukraine and poverty level among males in the United States with a correlation coefficient (R) of 0.628 and weighted average of 10.7%. Similarly, the statistical analysis conducted on geographies consisting of 102,467,050 people shows a weak positive correlation between the proportion of Cambodians and poverty level among males in the United States with a correlation coefficient (R) of 0.204 and weighted average of 10.4%, a difference of 3.3%.
Male Poverty Correlation Summary
| Measurement | Immigrants from Ukraine | Cambodian |
| Minimum | 2.8% | 2.2% |
| Maximum | 34.6% | 21.8% |
| Range | 31.8% | 19.6% |
| Mean | 12.2% | 9.8% |
| Median | 9.6% | 8.7% |
| Interquartile 25% (IQ1) | 8.1% | 6.5% |
| Interquartile 75% (IQ3) | 15.0% | 12.6% |
| Interquartile Range (IQR) | 6.9% | 6.1% |
| Standard Deviation (Sample) | 7.1% | 4.8% |
| Standard Deviation (Population) | 7.0% | 4.7% |
Similar Demographics by Male Poverty
Demographics Similar to Immigrants from Ukraine by Male Poverty
In terms of male poverty, the demographic groups most similar to Immigrants from Ukraine are Puget Sound Salish (10.7%, a difference of 0.0%), Immigrants from Western Europe (10.7%, a difference of 0.020%), Immigrants from Peru (10.7%, a difference of 0.030%), Chilean (10.7%, a difference of 0.080%), and Immigrants from Belarus (10.7%, a difference of 0.19%).
| Demographics | Rating | Rank | Male Poverty |
| Immigrants | Hungary | 87.6 /100 | #119 | Excellent 10.7% |
| Immigrants | China | 87.1 /100 | #120 | Excellent 10.7% |
| Peruvians | 87.1 /100 | #121 | Excellent 10.7% |
| Native Hawaiians | 87.0 /100 | #122 | Excellent 10.7% |
| South Africans | 86.8 /100 | #123 | Excellent 10.7% |
| French | 86.7 /100 | #124 | Excellent 10.7% |
| Immigrants | Norway | 86.0 /100 | #125 | Excellent 10.7% |
| Immigrants | Ukraine | 84.3 /100 | #126 | Excellent 10.7% |
| Puget Sound Salish | 84.3 /100 | #127 | Excellent 10.7% |
| Immigrants | Western Europe | 84.2 /100 | #128 | Excellent 10.7% |
| Immigrants | Peru | 84.1 /100 | #129 | Excellent 10.7% |
| Chileans | 83.9 /100 | #130 | Excellent 10.7% |
| Immigrants | Belarus | 83.3 /100 | #131 | Excellent 10.7% |
| Immigrants | Vietnam | 83.0 /100 | #132 | Excellent 10.8% |
| Pakistanis | 83.0 /100 | #133 | Excellent 10.8% |
Demographics Similar to Cambodians by Male Poverty
In terms of male poverty, the demographic groups most similar to Cambodians are Immigrants from Denmark (10.4%, a difference of 0.0%), Indian (Asian) (10.4%, a difference of 0.030%), British (10.4%, a difference of 0.10%), Northern European (10.4%, a difference of 0.14%), and Immigrants from Eastern Asia (10.4%, a difference of 0.18%).
| Demographics | Rating | Rank | Male Poverty |
| Belgians | 95.9 /100 | #81 | Exceptional 10.3% |
| Egyptians | 95.9 /100 | #82 | Exceptional 10.3% |
| Immigrants | Sweden | 95.7 /100 | #83 | Exceptional 10.3% |
| Czechoslovakians | 95.6 /100 | #84 | Exceptional 10.3% |
| Immigrants | England | 95.5 /100 | #85 | Exceptional 10.4% |
| Immigrants | Eastern Asia | 95.3 /100 | #86 | Exceptional 10.4% |
| Northern Europeans | 95.2 /100 | #87 | Exceptional 10.4% |
| Cambodians | 95.0 /100 | #88 | Exceptional 10.4% |
| Immigrants | Denmark | 95.0 /100 | #89 | Exceptional 10.4% |
| Indians (Asian) | 94.9 /100 | #90 | Exceptional 10.4% |
| British | 94.8 /100 | #91 | Exceptional 10.4% |
| Jordanians | 94.4 /100 | #92 | Exceptional 10.4% |
| Australians | 94.4 /100 | #93 | Exceptional 10.4% |
| Immigrants | South Africa | 94.1 /100 | #94 | Exceptional 10.4% |
| Scottish | 94.0 /100 | #95 | Exceptional 10.4% |