Immigrants from Ukraine vs Guatemalan Male Poverty
COMPARE
Immigrants from Ukraine
Guatemalan
Male Poverty
Male Poverty Comparison
Immigrants from Ukraine
Guatemalans
10.7%
MALE POVERTY
84.3/ 100
METRIC RATING
126th/ 347
METRIC RANK
13.8%
MALE POVERTY
0.0/ 100
METRIC RATING
289th/ 347
METRIC RANK
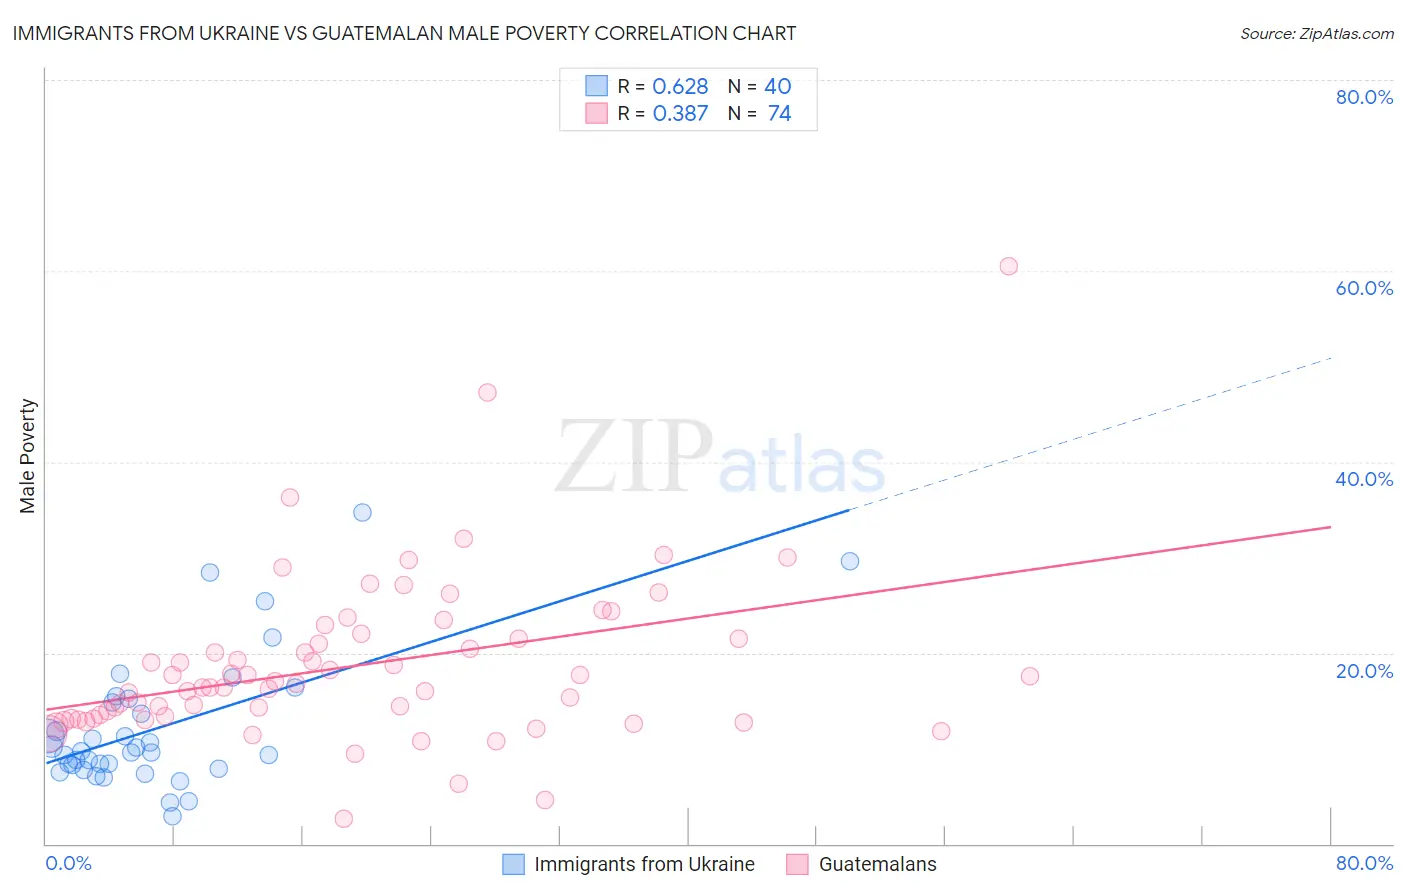
Immigrants from Ukraine vs Guatemalan Male Poverty Correlation Chart
The statistical analysis conducted on geographies consisting of 289,574,436 people shows a significant positive correlation between the proportion of Immigrants from Ukraine and poverty level among males in the United States with a correlation coefficient (R) of 0.628 and weighted average of 10.7%. Similarly, the statistical analysis conducted on geographies consisting of 409,206,123 people shows a mild positive correlation between the proportion of Guatemalans and poverty level among males in the United States with a correlation coefficient (R) of 0.387 and weighted average of 13.8%, a difference of 28.7%.
Male Poverty Correlation Summary
| Measurement | Immigrants from Ukraine | Guatemalan |
| Minimum | 2.8% | 2.7% |
| Maximum | 34.6% | 60.5% |
| Range | 31.8% | 57.9% |
| Mean | 12.2% | 18.7% |
| Median | 9.6% | 16.6% |
| Interquartile 25% (IQ1) | 8.1% | 13.1% |
| Interquartile 75% (IQ3) | 15.0% | 21.5% |
| Interquartile Range (IQR) | 6.9% | 8.4% |
| Standard Deviation (Sample) | 7.1% | 8.7% |
| Standard Deviation (Population) | 7.0% | 8.7% |
Similar Demographics by Male Poverty
Demographics Similar to Immigrants from Ukraine by Male Poverty
In terms of male poverty, the demographic groups most similar to Immigrants from Ukraine are Puget Sound Salish (10.7%, a difference of 0.0%), Immigrants from Western Europe (10.7%, a difference of 0.020%), Immigrants from Peru (10.7%, a difference of 0.030%), Chilean (10.7%, a difference of 0.080%), and Immigrants from Belarus (10.7%, a difference of 0.19%).
| Demographics | Rating | Rank | Male Poverty |
| Immigrants | Hungary | 87.6 /100 | #119 | Excellent 10.7% |
| Immigrants | China | 87.1 /100 | #120 | Excellent 10.7% |
| Peruvians | 87.1 /100 | #121 | Excellent 10.7% |
| Native Hawaiians | 87.0 /100 | #122 | Excellent 10.7% |
| South Africans | 86.8 /100 | #123 | Excellent 10.7% |
| French | 86.7 /100 | #124 | Excellent 10.7% |
| Immigrants | Norway | 86.0 /100 | #125 | Excellent 10.7% |
| Immigrants | Ukraine | 84.3 /100 | #126 | Excellent 10.7% |
| Puget Sound Salish | 84.3 /100 | #127 | Excellent 10.7% |
| Immigrants | Western Europe | 84.2 /100 | #128 | Excellent 10.7% |
| Immigrants | Peru | 84.1 /100 | #129 | Excellent 10.7% |
| Chileans | 83.9 /100 | #130 | Excellent 10.7% |
| Immigrants | Belarus | 83.3 /100 | #131 | Excellent 10.7% |
| Immigrants | Vietnam | 83.0 /100 | #132 | Excellent 10.8% |
| Pakistanis | 83.0 /100 | #133 | Excellent 10.8% |
Demographics Similar to Guatemalans by Male Poverty
In terms of male poverty, the demographic groups most similar to Guatemalans are Immigrants from Zaire (13.8%, a difference of 0.010%), Vietnamese (13.8%, a difference of 0.10%), Immigrants from St. Vincent and the Grenadines (13.8%, a difference of 0.17%), Indonesian (13.8%, a difference of 0.26%), and Immigrants from Belize (13.8%, a difference of 0.27%).
| Demographics | Rating | Rank | Male Poverty |
| Immigrants | Cabo Verde | 0.0 /100 | #282 | Tragic 13.7% |
| Comanche | 0.0 /100 | #283 | Tragic 13.8% |
| Immigrants | Haiti | 0.0 /100 | #284 | Tragic 13.8% |
| West Indians | 0.0 /100 | #285 | Tragic 13.8% |
| Shoshone | 0.0 /100 | #286 | Tragic 13.8% |
| Immigrants | Barbados | 0.0 /100 | #287 | Tragic 13.8% |
| Immigrants | St. Vincent and the Grenadines | 0.0 /100 | #288 | Tragic 13.8% |
| Guatemalans | 0.0 /100 | #289 | Tragic 13.8% |
| Immigrants | Zaire | 0.0 /100 | #290 | Tragic 13.8% |
| Vietnamese | 0.0 /100 | #291 | Tragic 13.8% |
| Indonesians | 0.0 /100 | #292 | Tragic 13.8% |
| Immigrants | Belize | 0.0 /100 | #293 | Tragic 13.8% |
| Hispanics or Latinos | 0.0 /100 | #294 | Tragic 13.9% |
| Immigrants | Central America | 0.0 /100 | #295 | Tragic 13.9% |
| Cajuns | 0.0 /100 | #296 | Tragic 13.9% |