Immigrants from Ukraine vs Immigrants from France Male Poverty
COMPARE
Immigrants from Ukraine
Immigrants from France
Male Poverty
Male Poverty Comparison
Immigrants from Ukraine
Immigrants from France
10.7%
MALE POVERTY
84.3/ 100
METRIC RATING
126th/ 347
METRIC RANK
10.9%
MALE POVERTY
75.8/ 100
METRIC RATING
141st/ 347
METRIC RANK
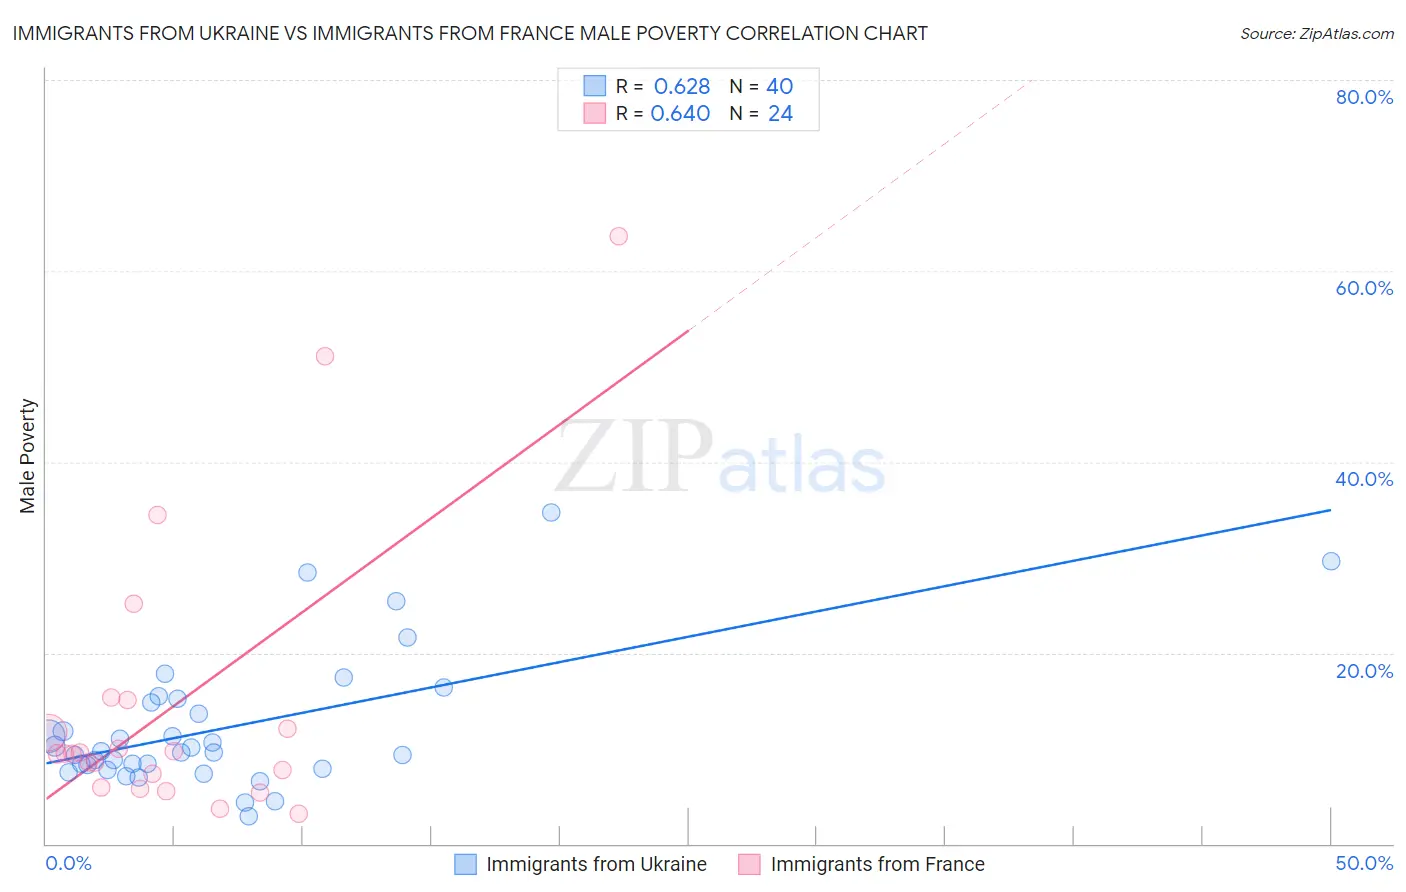
Immigrants from Ukraine vs Immigrants from France Male Poverty Correlation Chart
The statistical analysis conducted on geographies consisting of 289,574,436 people shows a significant positive correlation between the proportion of Immigrants from Ukraine and poverty level among males in the United States with a correlation coefficient (R) of 0.628 and weighted average of 10.7%. Similarly, the statistical analysis conducted on geographies consisting of 287,760,426 people shows a significant positive correlation between the proportion of Immigrants from France and poverty level among males in the United States with a correlation coefficient (R) of 0.640 and weighted average of 10.9%, a difference of 1.4%.
Male Poverty Correlation Summary
| Measurement | Immigrants from Ukraine | Immigrants from France |
| Minimum | 2.8% | 3.1% |
| Maximum | 34.6% | 63.6% |
| Range | 31.8% | 60.5% |
| Mean | 12.2% | 14.5% |
| Median | 9.6% | 9.5% |
| Interquartile 25% (IQ1) | 8.1% | 6.6% |
| Interquartile 75% (IQ3) | 15.0% | 13.6% |
| Interquartile Range (IQR) | 6.9% | 6.9% |
| Standard Deviation (Sample) | 7.1% | 15.0% |
| Standard Deviation (Population) | 7.0% | 14.7% |
Demographics Similar to Immigrants from Ukraine and Immigrants from France by Male Poverty
In terms of male poverty, the demographic groups most similar to Immigrants from Ukraine are Puget Sound Salish (10.7%, a difference of 0.0%), Immigrants from Western Europe (10.7%, a difference of 0.020%), Immigrants from Peru (10.7%, a difference of 0.030%), Chilean (10.7%, a difference of 0.080%), and Immigrants from Belarus (10.7%, a difference of 0.19%). Similarly, the demographic groups most similar to Immigrants from France are Tlingit-Haida (10.9%, a difference of 0.030%), Basque (10.9%, a difference of 0.17%), Immigrants from Jordan (10.8%, a difference of 0.23%), Yugoslavian (10.8%, a difference of 0.34%), and Immigrants from Switzerland (10.8%, a difference of 0.49%).
| Demographics | Rating | Rank | Male Poverty |
| South Africans | 86.8 /100 | #123 | Excellent 10.7% |
| French | 86.7 /100 | #124 | Excellent 10.7% |
| Immigrants | Norway | 86.0 /100 | #125 | Excellent 10.7% |
| Immigrants | Ukraine | 84.3 /100 | #126 | Excellent 10.7% |
| Puget Sound Salish | 84.3 /100 | #127 | Excellent 10.7% |
| Immigrants | Western Europe | 84.2 /100 | #128 | Excellent 10.7% |
| Immigrants | Peru | 84.1 /100 | #129 | Excellent 10.7% |
| Chileans | 83.9 /100 | #130 | Excellent 10.7% |
| Immigrants | Belarus | 83.3 /100 | #131 | Excellent 10.7% |
| Immigrants | Vietnam | 83.0 /100 | #132 | Excellent 10.8% |
| Pakistanis | 83.0 /100 | #133 | Excellent 10.8% |
| New Zealanders | 82.9 /100 | #134 | Excellent 10.8% |
| Brazilians | 82.7 /100 | #135 | Excellent 10.8% |
| Immigrants | Israel | 80.9 /100 | #136 | Excellent 10.8% |
| Immigrants | Switzerland | 79.2 /100 | #137 | Good 10.8% |
| Yugoslavians | 78.2 /100 | #138 | Good 10.8% |
| Immigrants | Jordan | 77.5 /100 | #139 | Good 10.8% |
| Tlingit-Haida | 76.1 /100 | #140 | Good 10.9% |
| Immigrants | France | 75.8 /100 | #141 | Good 10.9% |
| Basques | 74.6 /100 | #142 | Good 10.9% |
| Afghans | 71.9 /100 | #143 | Good 10.9% |