Panamanian vs Cambodian Male Poverty
COMPARE
Panamanian
Cambodian
Male Poverty
Male Poverty Comparison
Panamanians
Cambodians
11.9%
MALE POVERTY
6.2/ 100
METRIC RATING
205th/ 347
METRIC RANK
10.4%
MALE POVERTY
95.0/ 100
METRIC RATING
88th/ 347
METRIC RANK
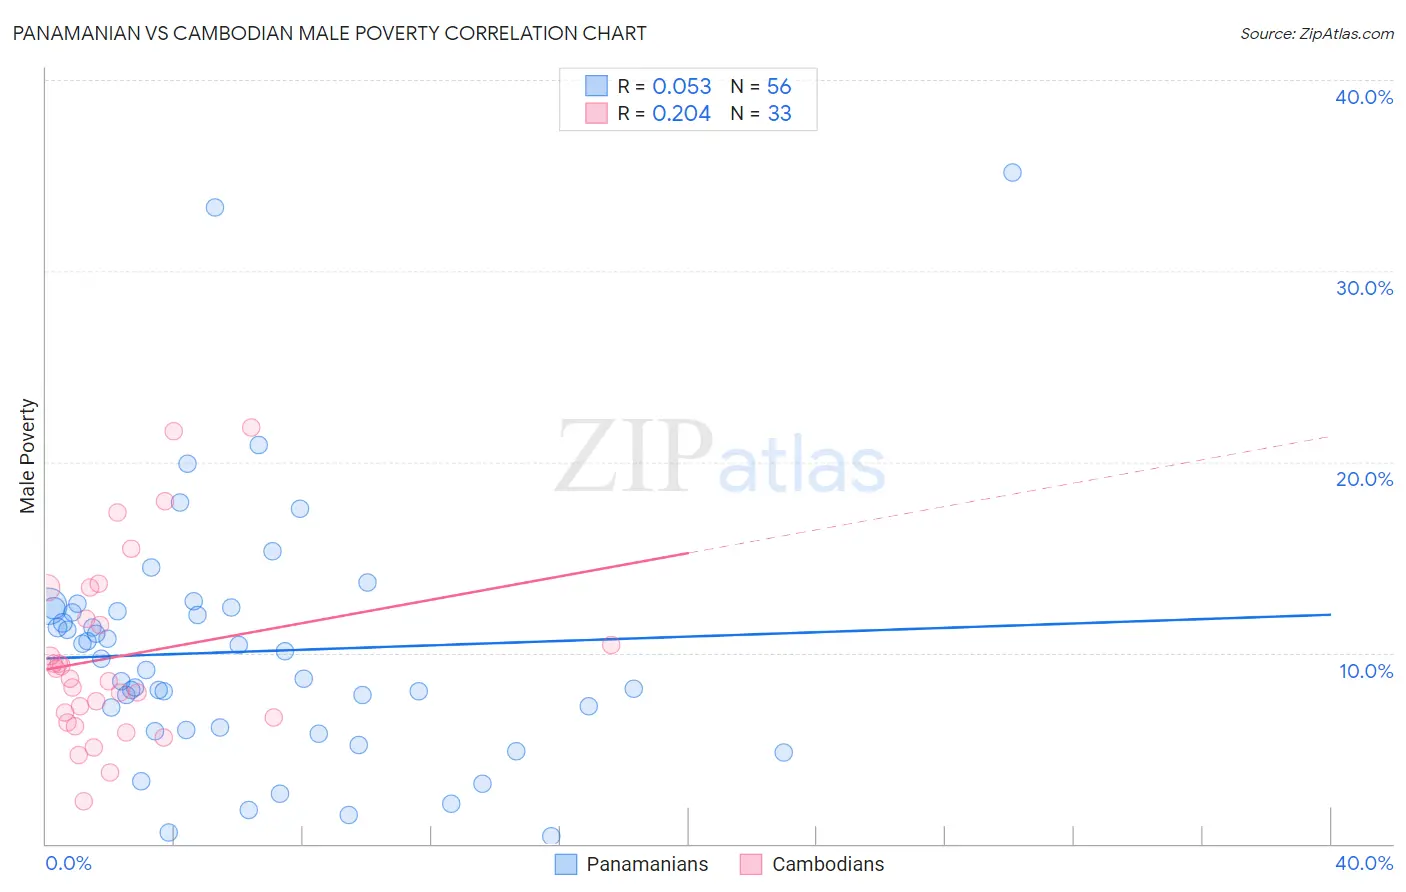
Panamanian vs Cambodian Male Poverty Correlation Chart
The statistical analysis conducted on geographies consisting of 281,029,832 people shows a slight positive correlation between the proportion of Panamanians and poverty level among males in the United States with a correlation coefficient (R) of 0.053 and weighted average of 11.9%. Similarly, the statistical analysis conducted on geographies consisting of 102,467,050 people shows a weak positive correlation between the proportion of Cambodians and poverty level among males in the United States with a correlation coefficient (R) of 0.204 and weighted average of 10.4%, a difference of 14.9%.
Male Poverty Correlation Summary
| Measurement | Panamanian | Cambodian |
| Minimum | 0.40% | 2.2% |
| Maximum | 35.1% | 21.8% |
| Range | 34.7% | 19.6% |
| Mean | 10.1% | 9.8% |
| Median | 9.4% | 8.7% |
| Interquartile 25% (IQ1) | 6.0% | 6.5% |
| Interquartile 75% (IQ3) | 12.2% | 12.6% |
| Interquartile Range (IQR) | 6.2% | 6.1% |
| Standard Deviation (Sample) | 6.5% | 4.8% |
| Standard Deviation (Population) | 6.5% | 4.7% |
Similar Demographics by Male Poverty
Demographics Similar to Panamanians by Male Poverty
In terms of male poverty, the demographic groups most similar to Panamanians are Immigrants from Eastern Africa (12.0%, a difference of 0.35%), Malaysian (12.0%, a difference of 0.45%), Immigrants from Uganda (11.8%, a difference of 0.78%), Immigrants (12.0%, a difference of 0.78%), and Immigrants from the Azores (12.0%, a difference of 0.90%).
| Demographics | Rating | Rank | Male Poverty |
| Iraqis | 14.7 /100 | #198 | Poor 11.7% |
| Spanish | 14.1 /100 | #199 | Poor 11.7% |
| Immigrants | Lebanon | 13.6 /100 | #200 | Poor 11.7% |
| Spaniards | 13.5 /100 | #201 | Poor 11.7% |
| Aleuts | 10.4 /100 | #202 | Poor 11.8% |
| Immigrants | Western Asia | 9.8 /100 | #203 | Tragic 11.8% |
| Immigrants | Uganda | 8.5 /100 | #204 | Tragic 11.8% |
| Panamanians | 6.2 /100 | #205 | Tragic 11.9% |
| Immigrants | Eastern Africa | 5.4 /100 | #206 | Tragic 12.0% |
| Malaysians | 5.2 /100 | #207 | Tragic 12.0% |
| Immigrants | Immigrants | 4.5 /100 | #208 | Tragic 12.0% |
| Immigrants | Azores | 4.3 /100 | #209 | Tragic 12.0% |
| Moroccans | 4.2 /100 | #210 | Tragic 12.0% |
| Immigrants | Panama | 4.0 /100 | #211 | Tragic 12.1% |
| Americans | 3.2 /100 | #212 | Tragic 12.1% |
Demographics Similar to Cambodians by Male Poverty
In terms of male poverty, the demographic groups most similar to Cambodians are Immigrants from Denmark (10.4%, a difference of 0.0%), Indian (Asian) (10.4%, a difference of 0.030%), British (10.4%, a difference of 0.10%), Northern European (10.4%, a difference of 0.14%), and Immigrants from Eastern Asia (10.4%, a difference of 0.18%).
| Demographics | Rating | Rank | Male Poverty |
| Belgians | 95.9 /100 | #81 | Exceptional 10.3% |
| Egyptians | 95.9 /100 | #82 | Exceptional 10.3% |
| Immigrants | Sweden | 95.7 /100 | #83 | Exceptional 10.3% |
| Czechoslovakians | 95.6 /100 | #84 | Exceptional 10.3% |
| Immigrants | England | 95.5 /100 | #85 | Exceptional 10.4% |
| Immigrants | Eastern Asia | 95.3 /100 | #86 | Exceptional 10.4% |
| Northern Europeans | 95.2 /100 | #87 | Exceptional 10.4% |
| Cambodians | 95.0 /100 | #88 | Exceptional 10.4% |
| Immigrants | Denmark | 95.0 /100 | #89 | Exceptional 10.4% |
| Indians (Asian) | 94.9 /100 | #90 | Exceptional 10.4% |
| British | 94.8 /100 | #91 | Exceptional 10.4% |
| Jordanians | 94.4 /100 | #92 | Exceptional 10.4% |
| Australians | 94.4 /100 | #93 | Exceptional 10.4% |
| Immigrants | South Africa | 94.1 /100 | #94 | Exceptional 10.4% |
| Scottish | 94.0 /100 | #95 | Exceptional 10.4% |