Immigrants from Uganda vs Bhutanese Family Poverty
COMPARE
Immigrants from Uganda
Bhutanese
Family Poverty
Family Poverty Comparison
Immigrants from Uganda
Bhutanese
9.1%
FAMILY POVERTY
43.4/ 100
METRIC RATING
180th/ 347
METRIC RANK
7.0%
FAMILY POVERTY
99.9/ 100
METRIC RATING
8th/ 347
METRIC RANK
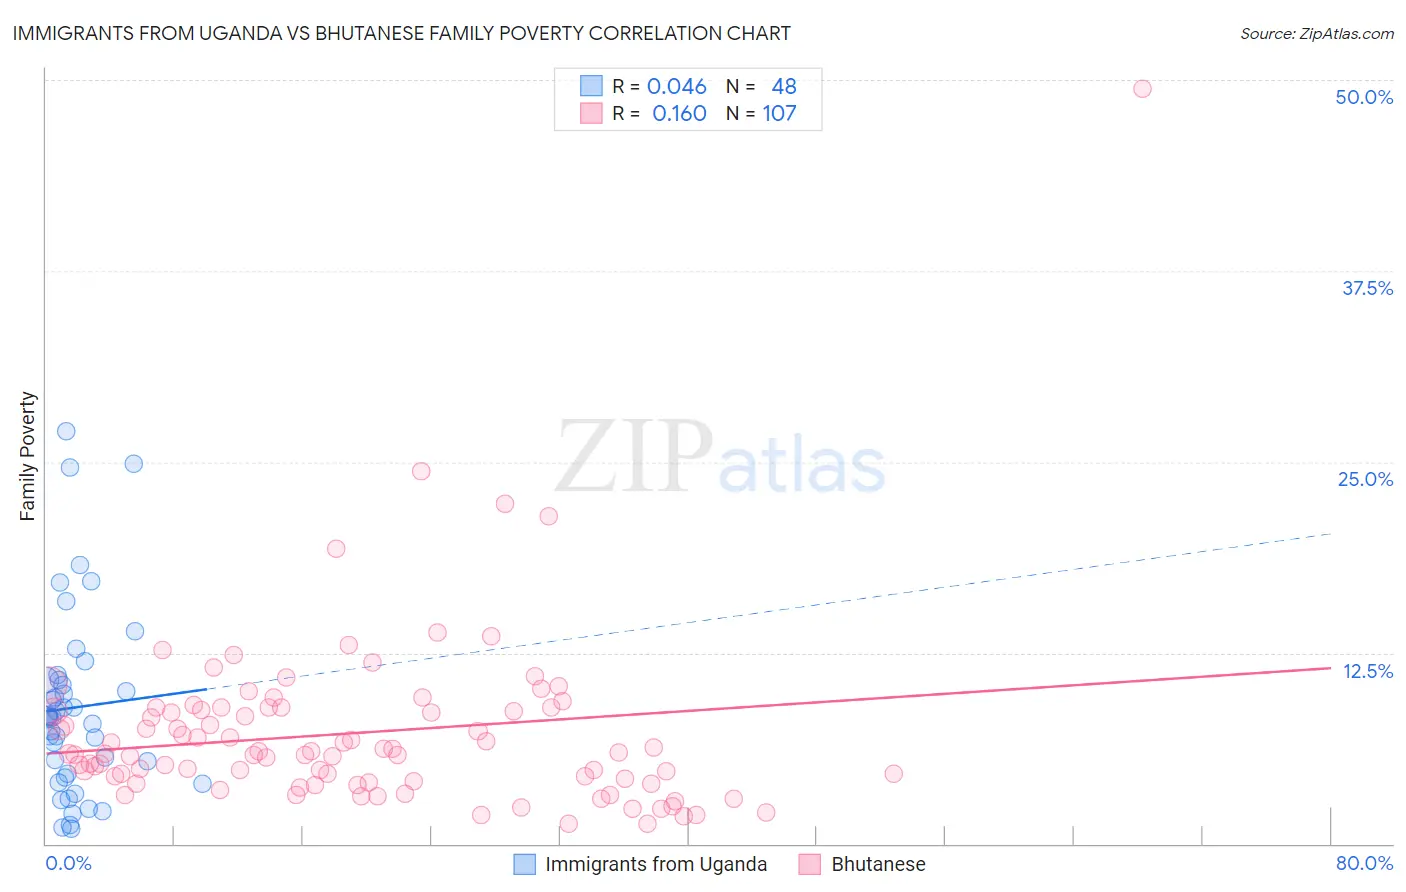
Immigrants from Uganda vs Bhutanese Family Poverty Correlation Chart
The statistical analysis conducted on geographies consisting of 125,892,815 people shows no correlation between the proportion of Immigrants from Uganda and poverty level among families in the United States with a correlation coefficient (R) of 0.046 and weighted average of 9.1%. Similarly, the statistical analysis conducted on geographies consisting of 453,917,990 people shows a poor positive correlation between the proportion of Bhutanese and poverty level among families in the United States with a correlation coefficient (R) of 0.160 and weighted average of 7.0%, a difference of 28.9%.
Family Poverty Correlation Summary
| Measurement | Immigrants from Uganda | Bhutanese |
| Minimum | 1.0% | 1.3% |
| Maximum | 27.0% | 49.5% |
| Range | 26.0% | 48.2% |
| Mean | 8.9% | 7.3% |
| Median | 8.3% | 5.9% |
| Interquartile 25% (IQ1) | 4.5% | 4.1% |
| Interquartile 75% (IQ3) | 10.7% | 8.9% |
| Interquartile Range (IQR) | 6.3% | 4.9% |
| Standard Deviation (Sample) | 6.1% | 5.9% |
| Standard Deviation (Population) | 6.0% | 5.8% |
Similar Demographics by Family Poverty
Demographics Similar to Immigrants from Uganda by Family Poverty
In terms of family poverty, the demographic groups most similar to Immigrants from Uganda are Immigrants from Iraq (9.1%, a difference of 0.13%), Hmong (9.1%, a difference of 0.43%), Immigrants from Morocco (9.1%, a difference of 0.43%), Immigrants from Cameroon (9.0%, a difference of 0.49%), and Hawaiian (9.0%, a difference of 0.50%).
| Demographics | Rating | Rank | Family Poverty |
| Immigrants | Fiji | 56.4 /100 | #173 | Average 8.9% |
| Immigrants | Albania | 50.0 /100 | #174 | Average 9.0% |
| Costa Ricans | 49.3 /100 | #175 | Average 9.0% |
| Immigrants | Syria | 47.5 /100 | #176 | Average 9.0% |
| Hawaiians | 47.2 /100 | #177 | Average 9.0% |
| Immigrants | Cameroon | 47.1 /100 | #178 | Average 9.0% |
| Immigrants | Iraq | 44.4 /100 | #179 | Average 9.1% |
| Immigrants | Uganda | 43.4 /100 | #180 | Average 9.1% |
| Hmong | 40.2 /100 | #181 | Average 9.1% |
| Immigrants | Morocco | 40.2 /100 | #182 | Average 9.1% |
| Uruguayans | 39.2 /100 | #183 | Fair 9.1% |
| South American Indians | 38.7 /100 | #184 | Fair 9.1% |
| Immigrants | Saudi Arabia | 38.6 /100 | #185 | Fair 9.1% |
| Colombians | 36.1 /100 | #186 | Fair 9.2% |
| Delaware | 35.4 /100 | #187 | Fair 9.2% |
Demographics Similar to Bhutanese by Family Poverty
In terms of family poverty, the demographic groups most similar to Bhutanese are Latvian (7.1%, a difference of 0.44%), Bulgarian (7.1%, a difference of 0.70%), Immigrants from Singapore (7.1%, a difference of 0.71%), Immigrants from Ireland (7.0%, a difference of 0.91%), and Maltese (7.1%, a difference of 1.0%).
| Demographics | Rating | Rank | Family Poverty |
| Immigrants | India | 100.0 /100 | #1 | Exceptional 6.2% |
| Chinese | 100.0 /100 | #2 | Exceptional 6.5% |
| Immigrants | Taiwan | 100.0 /100 | #3 | Exceptional 6.6% |
| Filipinos | 100.0 /100 | #4 | Exceptional 6.6% |
| Thais | 100.0 /100 | #5 | Exceptional 6.7% |
| Norwegians | 99.9 /100 | #6 | Exceptional 6.9% |
| Immigrants | Ireland | 99.9 /100 | #7 | Exceptional 7.0% |
| Bhutanese | 99.9 /100 | #8 | Exceptional 7.0% |
| Latvians | 99.9 /100 | #9 | Exceptional 7.1% |
| Bulgarians | 99.8 /100 | #10 | Exceptional 7.1% |
| Immigrants | Singapore | 99.8 /100 | #11 | Exceptional 7.1% |
| Maltese | 99.8 /100 | #12 | Exceptional 7.1% |
| Swedes | 99.8 /100 | #13 | Exceptional 7.1% |
| Iranians | 99.8 /100 | #14 | Exceptional 7.1% |
| Lithuanians | 99.8 /100 | #15 | Exceptional 7.2% |