Immigrants from Uganda vs Cypriot Family Poverty
COMPARE
Immigrants from Uganda
Cypriot
Family Poverty
Family Poverty Comparison
Immigrants from Uganda
Cypriots
9.1%
FAMILY POVERTY
43.4/ 100
METRIC RATING
180th/ 347
METRIC RANK
7.3%
FAMILY POVERTY
99.6/ 100
METRIC RATING
26th/ 347
METRIC RANK
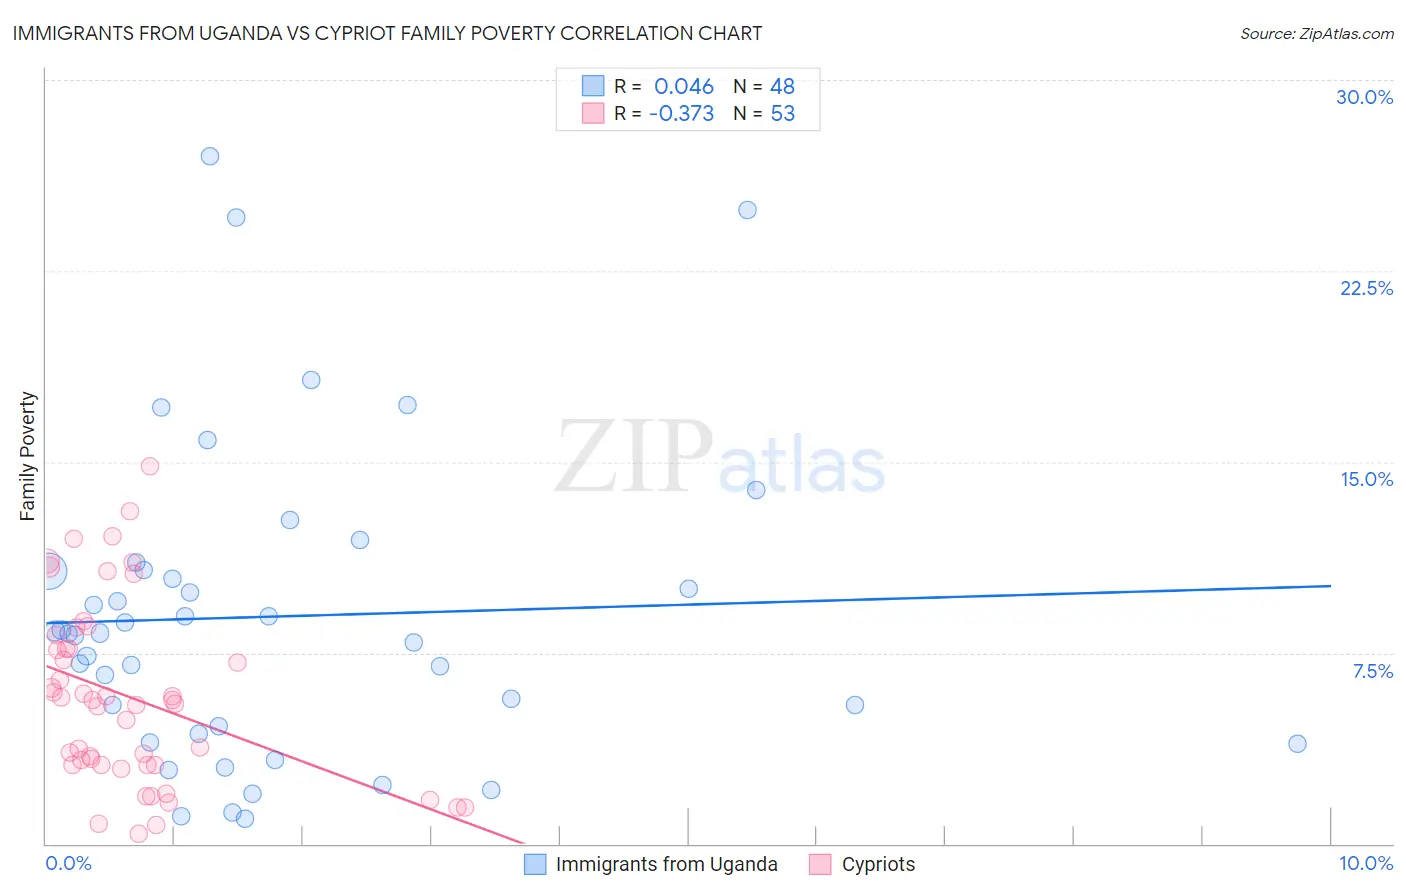
Immigrants from Uganda vs Cypriot Family Poverty Correlation Chart
The statistical analysis conducted on geographies consisting of 125,892,815 people shows no correlation between the proportion of Immigrants from Uganda and poverty level among families in the United States with a correlation coefficient (R) of 0.046 and weighted average of 9.1%. Similarly, the statistical analysis conducted on geographies consisting of 61,784,976 people shows a mild negative correlation between the proportion of Cypriots and poverty level among families in the United States with a correlation coefficient (R) of -0.373 and weighted average of 7.3%, a difference of 23.7%.
Family Poverty Correlation Summary
| Measurement | Immigrants from Uganda | Cypriot |
| Minimum | 1.0% | 0.41% |
| Maximum | 27.0% | 14.8% |
| Range | 26.0% | 14.4% |
| Mean | 8.9% | 5.8% |
| Median | 8.3% | 5.6% |
| Interquartile 25% (IQ1) | 4.5% | 3.1% |
| Interquartile 75% (IQ3) | 10.7% | 7.9% |
| Interquartile Range (IQR) | 6.3% | 4.9% |
| Standard Deviation (Sample) | 6.1% | 3.6% |
| Standard Deviation (Population) | 6.0% | 3.5% |
Similar Demographics by Family Poverty
Demographics Similar to Immigrants from Uganda by Family Poverty
In terms of family poverty, the demographic groups most similar to Immigrants from Uganda are Immigrants from Iraq (9.1%, a difference of 0.13%), Hmong (9.1%, a difference of 0.43%), Immigrants from Morocco (9.1%, a difference of 0.43%), Immigrants from Cameroon (9.0%, a difference of 0.49%), and Hawaiian (9.0%, a difference of 0.50%).
| Demographics | Rating | Rank | Family Poverty |
| Immigrants | Fiji | 56.4 /100 | #173 | Average 8.9% |
| Immigrants | Albania | 50.0 /100 | #174 | Average 9.0% |
| Costa Ricans | 49.3 /100 | #175 | Average 9.0% |
| Immigrants | Syria | 47.5 /100 | #176 | Average 9.0% |
| Hawaiians | 47.2 /100 | #177 | Average 9.0% |
| Immigrants | Cameroon | 47.1 /100 | #178 | Average 9.0% |
| Immigrants | Iraq | 44.4 /100 | #179 | Average 9.1% |
| Immigrants | Uganda | 43.4 /100 | #180 | Average 9.1% |
| Hmong | 40.2 /100 | #181 | Average 9.1% |
| Immigrants | Morocco | 40.2 /100 | #182 | Average 9.1% |
| Uruguayans | 39.2 /100 | #183 | Fair 9.1% |
| South American Indians | 38.7 /100 | #184 | Fair 9.1% |
| Immigrants | Saudi Arabia | 38.6 /100 | #185 | Fair 9.1% |
| Colombians | 36.1 /100 | #186 | Fair 9.2% |
| Delaware | 35.4 /100 | #187 | Fair 9.2% |
Demographics Similar to Cypriots by Family Poverty
In terms of family poverty, the demographic groups most similar to Cypriots are Immigrants from Scotland (7.3%, a difference of 0.020%), Burmese (7.3%, a difference of 0.24%), Croatian (7.3%, a difference of 0.25%), Immigrants from Korea (7.4%, a difference of 0.40%), and Assyrian/Chaldean/Syriac (7.3%, a difference of 0.55%).
| Demographics | Rating | Rank | Family Poverty |
| Eastern Europeans | 99.7 /100 | #19 | Exceptional 7.2% |
| Immigrants | Hong Kong | 99.7 /100 | #20 | Exceptional 7.3% |
| Immigrants | Iran | 99.7 /100 | #21 | Exceptional 7.3% |
| Danes | 99.7 /100 | #22 | Exceptional 7.3% |
| Assyrians/Chaldeans/Syriacs | 99.7 /100 | #23 | Exceptional 7.3% |
| Croatians | 99.7 /100 | #24 | Exceptional 7.3% |
| Burmese | 99.7 /100 | #25 | Exceptional 7.3% |
| Cypriots | 99.6 /100 | #26 | Exceptional 7.3% |
| Immigrants | Scotland | 99.6 /100 | #27 | Exceptional 7.3% |
| Immigrants | Korea | 99.6 /100 | #28 | Exceptional 7.4% |
| Immigrants | Northern Europe | 99.6 /100 | #29 | Exceptional 7.4% |
| Italians | 99.6 /100 | #30 | Exceptional 7.4% |
| Czechs | 99.6 /100 | #31 | Exceptional 7.4% |
| Poles | 99.5 /100 | #32 | Exceptional 7.4% |
| Immigrants | Japan | 99.5 /100 | #33 | Exceptional 7.4% |