Immigrants from Syria vs Immigrants from Western Africa Male Poverty
COMPARE
Immigrants from Syria
Immigrants from Western Africa
Male Poverty
Male Poverty Comparison
Immigrants from Syria
Immigrants from Western Africa
11.3%
MALE POVERTY
40.3/ 100
METRIC RATING
179th/ 347
METRIC RANK
12.9%
MALE POVERTY
0.2/ 100
METRIC RATING
247th/ 347
METRIC RANK
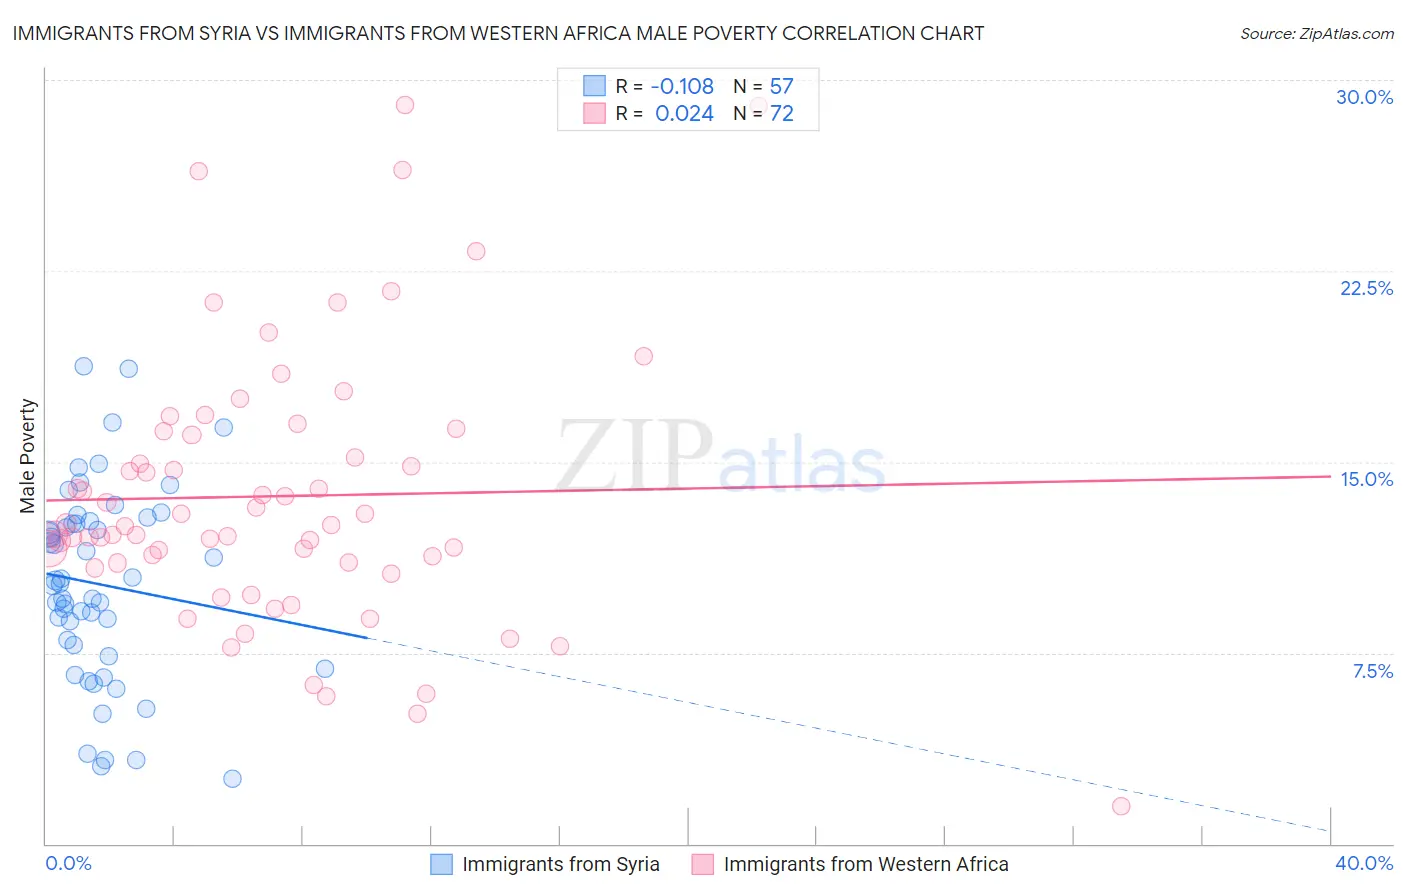
Immigrants from Syria vs Immigrants from Western Africa Male Poverty Correlation Chart
The statistical analysis conducted on geographies consisting of 173,977,512 people shows a poor negative correlation between the proportion of Immigrants from Syria and poverty level among males in the United States with a correlation coefficient (R) of -0.108 and weighted average of 11.3%. Similarly, the statistical analysis conducted on geographies consisting of 357,450,071 people shows no correlation between the proportion of Immigrants from Western Africa and poverty level among males in the United States with a correlation coefficient (R) of 0.024 and weighted average of 12.9%, a difference of 14.1%.
Male Poverty Correlation Summary
| Measurement | Immigrants from Syria | Immigrants from Western Africa |
| Minimum | 2.5% | 1.4% |
| Maximum | 18.7% | 29.0% |
| Range | 16.2% | 27.6% |
| Mean | 10.2% | 13.7% |
| Median | 10.2% | 12.5% |
| Interquartile 25% (IQ1) | 7.6% | 11.0% |
| Interquartile 75% (IQ3) | 12.6% | 16.1% |
| Interquartile Range (IQR) | 5.0% | 5.1% |
| Standard Deviation (Sample) | 3.8% | 5.3% |
| Standard Deviation (Population) | 3.7% | 5.3% |
Similar Demographics by Male Poverty
Demographics Similar to Immigrants from Syria by Male Poverty
In terms of male poverty, the demographic groups most similar to Immigrants from Syria are Immigrants from Morocco (11.3%, a difference of 0.010%), Immigrants from Costa Rica (11.3%, a difference of 0.080%), Mongolian (11.3%, a difference of 0.13%), Kenyan (11.3%, a difference of 0.19%), and Immigrants from South America (11.3%, a difference of 0.34%).
| Demographics | Rating | Rank | Male Poverty |
| Immigrants | Ethiopia | 50.7 /100 | #172 | Average 11.2% |
| Pennsylvania Germans | 50.5 /100 | #173 | Average 11.2% |
| Immigrants | Oceania | 50.0 /100 | #174 | Average 11.2% |
| Celtics | 47.5 /100 | #175 | Average 11.2% |
| Immigrants | Fiji | 46.0 /100 | #176 | Average 11.2% |
| Lebanese | 45.6 /100 | #177 | Average 11.2% |
| Immigrants | Cameroon | 44.5 /100 | #178 | Average 11.2% |
| Immigrants | Syria | 40.3 /100 | #179 | Average 11.3% |
| Immigrants | Morocco | 40.1 /100 | #180 | Average 11.3% |
| Immigrants | Costa Rica | 39.5 /100 | #181 | Fair 11.3% |
| Mongolians | 39.0 /100 | #182 | Fair 11.3% |
| Kenyans | 38.4 /100 | #183 | Fair 11.3% |
| Immigrants | South America | 36.9 /100 | #184 | Fair 11.3% |
| Immigrants | Afghanistan | 33.3 /100 | #185 | Fair 11.4% |
| Immigrants | Sierra Leone | 32.9 /100 | #186 | Fair 11.4% |
Demographics Similar to Immigrants from Western Africa by Male Poverty
In terms of male poverty, the demographic groups most similar to Immigrants from Western Africa are Immigrants from Sudan (12.9%, a difference of 0.060%), Potawatomi (12.9%, a difference of 0.13%), Immigrants from Nicaragua (12.9%, a difference of 0.14%), Immigrants from Cuba (12.9%, a difference of 0.24%), and Immigrants from Ecuador (12.9%, a difference of 0.27%).
| Demographics | Rating | Rank | Male Poverty |
| Immigrants | Middle Africa | 0.4 /100 | #240 | Tragic 12.7% |
| Sudanese | 0.3 /100 | #241 | Tragic 12.8% |
| Nepalese | 0.3 /100 | #242 | Tragic 12.8% |
| Alaskan Athabascans | 0.3 /100 | #243 | Tragic 12.8% |
| Tsimshian | 0.3 /100 | #244 | Tragic 12.8% |
| Liberians | 0.3 /100 | #245 | Tragic 12.8% |
| Immigrants | El Salvador | 0.2 /100 | #246 | Tragic 12.8% |
| Immigrants | Western Africa | 0.2 /100 | #247 | Tragic 12.9% |
| Immigrants | Sudan | 0.2 /100 | #248 | Tragic 12.9% |
| Potawatomi | 0.2 /100 | #249 | Tragic 12.9% |
| Immigrants | Nicaragua | 0.2 /100 | #250 | Tragic 12.9% |
| Immigrants | Cuba | 0.2 /100 | #251 | Tragic 12.9% |
| Immigrants | Ecuador | 0.2 /100 | #252 | Tragic 12.9% |
| Immigrants | Ghana | 0.2 /100 | #253 | Tragic 12.9% |
| Mexican American Indians | 0.1 /100 | #254 | Tragic 13.0% |