Immigrants from Switzerland vs Lithuanian Single Male Poverty
COMPARE
Immigrants from Switzerland
Lithuanian
Single Male Poverty
Single Male Poverty Comparison
Immigrants from Switzerland
Lithuanians
12.8%
SINGLE MALE POVERTY
43.1/ 100
METRIC RATING
178th/ 347
METRIC RANK
13.0%
SINGLE MALE POVERTY
22.1/ 100
METRIC RATING
198th/ 347
METRIC RANK
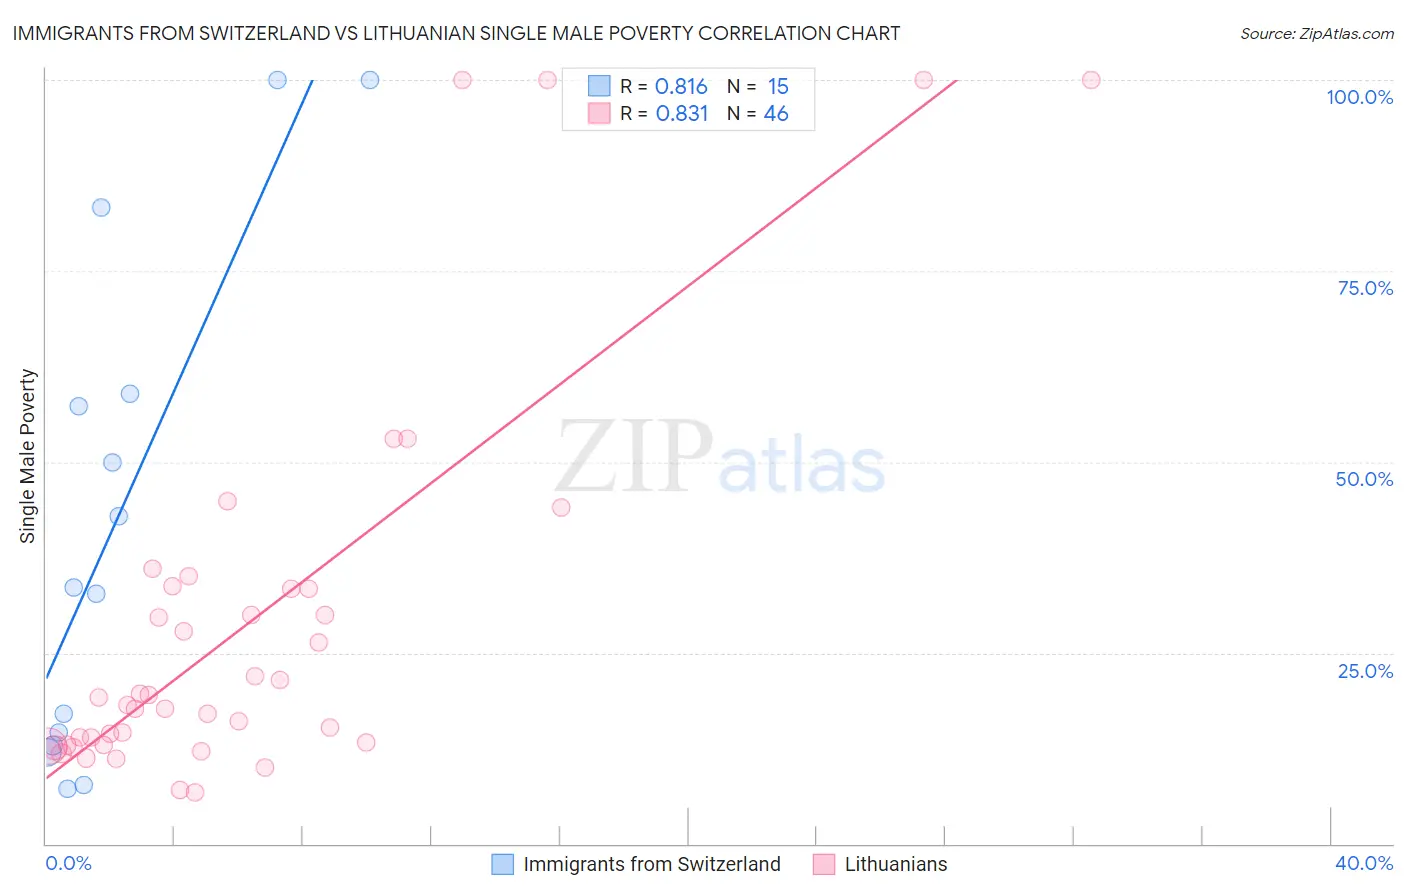
Immigrants from Switzerland vs Lithuanian Single Male Poverty Correlation Chart
The statistical analysis conducted on geographies consisting of 136,371,687 people shows a very strong positive correlation between the proportion of Immigrants from Switzerland and poverty level among single males in the United States with a correlation coefficient (R) of 0.816 and weighted average of 12.8%. Similarly, the statistical analysis conducted on geographies consisting of 363,241,212 people shows a very strong positive correlation between the proportion of Lithuanians and poverty level among single males in the United States with a correlation coefficient (R) of 0.831 and weighted average of 13.0%, a difference of 1.3%.
Single Male Poverty Correlation Summary
| Measurement | Immigrants from Switzerland | Lithuanian |
| Minimum | 7.2% | 6.7% |
| Maximum | 100.0% | 100.0% |
| Range | 92.8% | 93.3% |
| Mean | 42.0% | 28.6% |
| Median | 33.6% | 18.7% |
| Interquartile 25% (IQ1) | 12.9% | 12.9% |
| Interquartile 75% (IQ3) | 58.9% | 33.3% |
| Interquartile Range (IQR) | 46.0% | 20.5% |
| Standard Deviation (Sample) | 32.4% | 25.0% |
| Standard Deviation (Population) | 31.3% | 24.8% |
Demographics Similar to Immigrants from Switzerland and Lithuanians by Single Male Poverty
In terms of single male poverty, the demographic groups most similar to Immigrants from Switzerland are Israeli (12.9%, a difference of 0.11%), Immigrants from North America (12.9%, a difference of 0.29%), Panamanian (12.9%, a difference of 0.30%), Moroccan (12.9%, a difference of 0.34%), and Immigrants from West Indies (12.9%, a difference of 0.57%). Similarly, the demographic groups most similar to Lithuanians are Immigrants from Laos (13.0%, a difference of 0.070%), Immigrants from Grenada (13.0%, a difference of 0.080%), Immigrants from England (13.0%, a difference of 0.090%), Liberian (13.0%, a difference of 0.22%), and Immigrants from South Africa (13.0%, a difference of 0.29%).
| Demographics | Rating | Rank | Single Male Poverty |
| Immigrants | Switzerland | 43.1 /100 | #178 | Average 12.8% |
| Israelis | 41.0 /100 | #179 | Average 12.9% |
| Immigrants | North America | 37.7 /100 | #180 | Fair 12.9% |
| Panamanians | 37.6 /100 | #181 | Fair 12.9% |
| Moroccans | 36.8 /100 | #182 | Fair 12.9% |
| Immigrants | West Indies | 33.0 /100 | #183 | Fair 12.9% |
| Immigrants | Trinidad and Tobago | 32.5 /100 | #184 | Fair 12.9% |
| Norwegians | 32.0 /100 | #185 | Fair 12.9% |
| Nigerians | 31.9 /100 | #186 | Fair 12.9% |
| Immigrants | Kuwait | 31.9 /100 | #187 | Fair 12.9% |
| Macedonians | 31.5 /100 | #188 | Fair 12.9% |
| Portuguese | 30.2 /100 | #189 | Fair 12.9% |
| Arabs | 27.0 /100 | #190 | Fair 13.0% |
| Immigrants | Thailand | 26.6 /100 | #191 | Fair 13.0% |
| Immigrants | Jamaica | 26.5 /100 | #192 | Fair 13.0% |
| Immigrants | South Africa | 26.1 /100 | #193 | Fair 13.0% |
| Liberians | 25.2 /100 | #194 | Fair 13.0% |
| Immigrants | England | 23.4 /100 | #195 | Fair 13.0% |
| Immigrants | Grenada | 23.1 /100 | #196 | Fair 13.0% |
| Immigrants | Laos | 23.1 /100 | #197 | Fair 13.0% |
| Lithuanians | 22.1 /100 | #198 | Fair 13.0% |