Immigrants from Sweden vs Arapaho College, 1 year or more
COMPARE
Immigrants from Sweden
Arapaho
College, 1 year or more
College, 1 year or more Comparison
Immigrants from Sweden
Arapaho
66.8%
COLLEGE, 1 YEAR OR MORE
100.0/ 100
METRIC RATING
13th/ 347
METRIC RANK
54.1%
COLLEGE, 1 YEAR OR MORE
0.1/ 100
METRIC RATING
279th/ 347
METRIC RANK
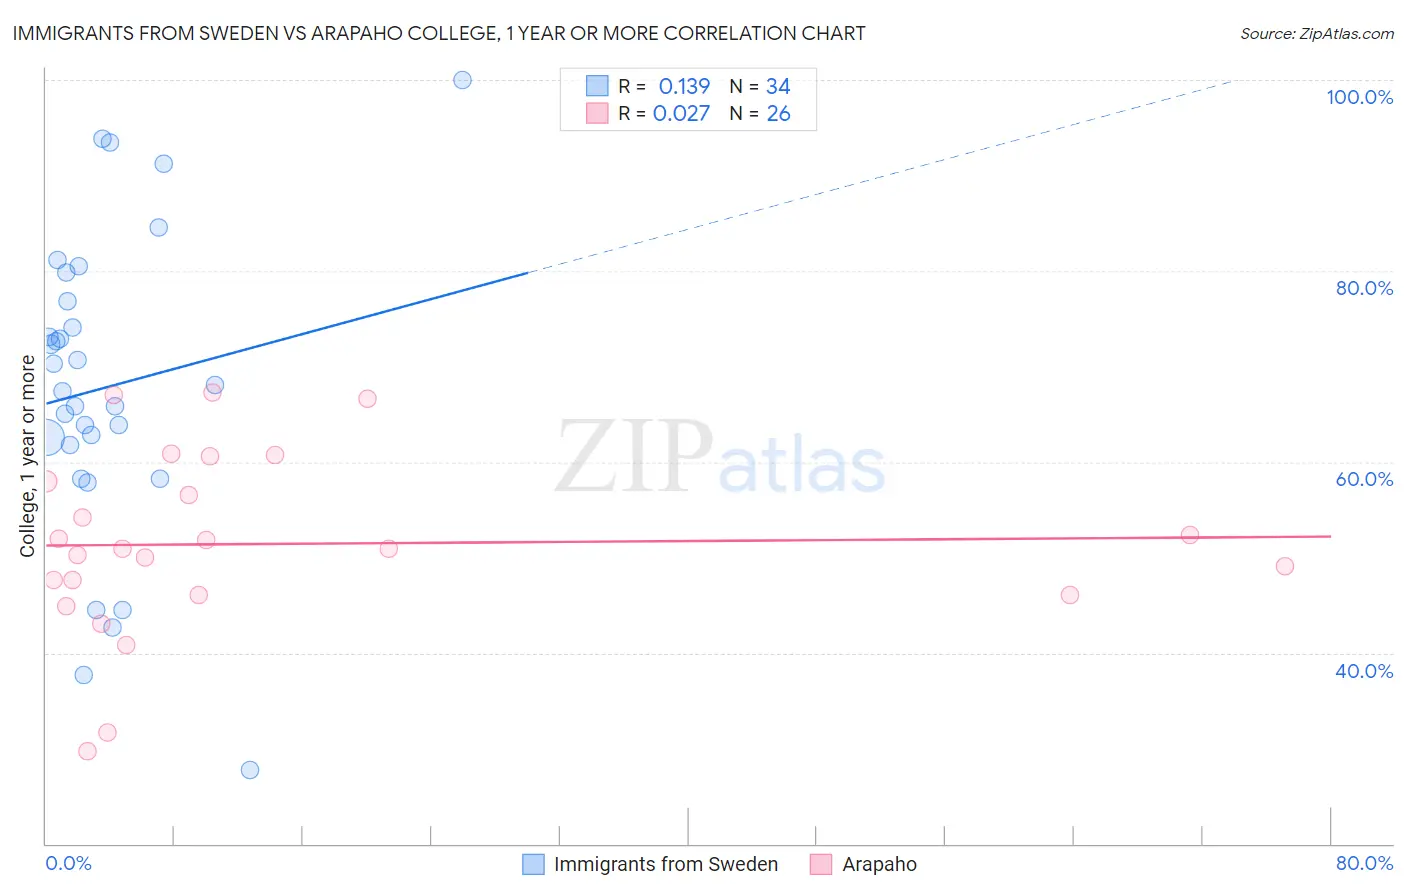
Immigrants from Sweden vs Arapaho College, 1 year or more Correlation Chart
The statistical analysis conducted on geographies consisting of 164,737,293 people shows a poor positive correlation between the proportion of Immigrants from Sweden and percentage of population with at least college, 1 year or more education in the United States with a correlation coefficient (R) of 0.139 and weighted average of 66.8%. Similarly, the statistical analysis conducted on geographies consisting of 29,780,040 people shows no correlation between the proportion of Arapaho and percentage of population with at least college, 1 year or more education in the United States with a correlation coefficient (R) of 0.027 and weighted average of 54.1%, a difference of 23.4%.
College, 1 year or more Correlation Summary
| Measurement | Immigrants from Sweden | Arapaho |
| Minimum | 27.7% | 29.7% |
| Maximum | 100.0% | 67.3% |
| Range | 72.3% | 37.6% |
| Mean | 67.8% | 51.4% |
| Median | 67.8% | 50.9% |
| Interquartile 25% (IQ1) | 61.7% | 46.1% |
| Interquartile 75% (IQ3) | 76.8% | 58.0% |
| Interquartile Range (IQR) | 15.1% | 11.9% |
| Standard Deviation (Sample) | 16.1% | 9.5% |
| Standard Deviation (Population) | 15.9% | 9.3% |
Similar Demographics by College, 1 year or more
Demographics Similar to Immigrants from Sweden by College, 1 year or more
In terms of college, 1 year or more, the demographic groups most similar to Immigrants from Sweden are Burmese (66.7%, a difference of 0.19%), Cambodian (66.7%, a difference of 0.19%), Immigrants from Japan (66.7%, a difference of 0.23%), Cypriot (67.0%, a difference of 0.31%), and Immigrants from Eastern Asia (66.6%, a difference of 0.34%).
| Demographics | Rating | Rank | College, 1 year or more |
| Immigrants | Iran | 100.0 /100 | #6 | Exceptional 69.5% |
| Okinawans | 100.0 /100 | #7 | Exceptional 69.0% |
| Thais | 100.0 /100 | #8 | Exceptional 68.6% |
| Immigrants | Israel | 100.0 /100 | #9 | Exceptional 67.8% |
| Immigrants | Australia | 100.0 /100 | #10 | Exceptional 67.7% |
| Immigrants | South Central Asia | 100.0 /100 | #11 | Exceptional 67.1% |
| Cypriots | 100.0 /100 | #12 | Exceptional 67.0% |
| Immigrants | Sweden | 100.0 /100 | #13 | Exceptional 66.8% |
| Burmese | 100.0 /100 | #14 | Exceptional 66.7% |
| Cambodians | 100.0 /100 | #15 | Exceptional 66.7% |
| Immigrants | Japan | 100.0 /100 | #16 | Exceptional 66.7% |
| Immigrants | Eastern Asia | 100.0 /100 | #17 | Exceptional 66.6% |
| Eastern Europeans | 100.0 /100 | #18 | Exceptional 66.6% |
| Immigrants | Switzerland | 100.0 /100 | #19 | Exceptional 66.5% |
| Immigrants | Korea | 100.0 /100 | #20 | Exceptional 66.5% |
Demographics Similar to Arapaho by College, 1 year or more
In terms of college, 1 year or more, the demographic groups most similar to Arapaho are Immigrants from Jamaica (54.2%, a difference of 0.020%), Cheyenne (54.1%, a difference of 0.060%), Colville (54.1%, a difference of 0.070%), Guyanese (54.1%, a difference of 0.11%), and Ecuadorian (54.3%, a difference of 0.34%).
| Demographics | Rating | Rank | College, 1 year or more |
| Comanche | 0.2 /100 | #272 | Tragic 54.4% |
| Immigrants | Grenada | 0.2 /100 | #273 | Tragic 54.4% |
| Belizeans | 0.2 /100 | #274 | Tragic 54.4% |
| Americans | 0.2 /100 | #275 | Tragic 54.4% |
| Shoshone | 0.2 /100 | #276 | Tragic 54.3% |
| Ecuadorians | 0.2 /100 | #277 | Tragic 54.3% |
| Immigrants | Jamaica | 0.1 /100 | #278 | Tragic 54.2% |
| Arapaho | 0.1 /100 | #279 | Tragic 54.1% |
| Cheyenne | 0.1 /100 | #280 | Tragic 54.1% |
| Colville | 0.1 /100 | #281 | Tragic 54.1% |
| Guyanese | 0.1 /100 | #282 | Tragic 54.1% |
| Nicaraguans | 0.1 /100 | #283 | Tragic 53.9% |
| Ute | 0.1 /100 | #284 | Tragic 53.8% |
| Immigrants | Guyana | 0.1 /100 | #285 | Tragic 53.5% |
| Central American Indians | 0.1 /100 | #286 | Tragic 53.5% |