Immigrants from Sudan vs U.S. Virgin Islander Unemployment Among Seniors over 65 years
COMPARE
Immigrants from Sudan
U.S. Virgin Islander
Unemployment Among Seniors over 65 years
Unemployment Among Seniors over 65 years Comparison
Immigrants from Sudan
U.S. Virgin Islanders
4.9%
UNEMPLOYMENT AMONG SENIORS OVER 65 YEARS
99.8/ 100
METRIC RATING
53rd/ 347
METRIC RANK
5.5%
UNEMPLOYMENT AMONG SENIORS OVER 65 YEARS
0.0/ 100
METRIC RATING
288th/ 347
METRIC RANK
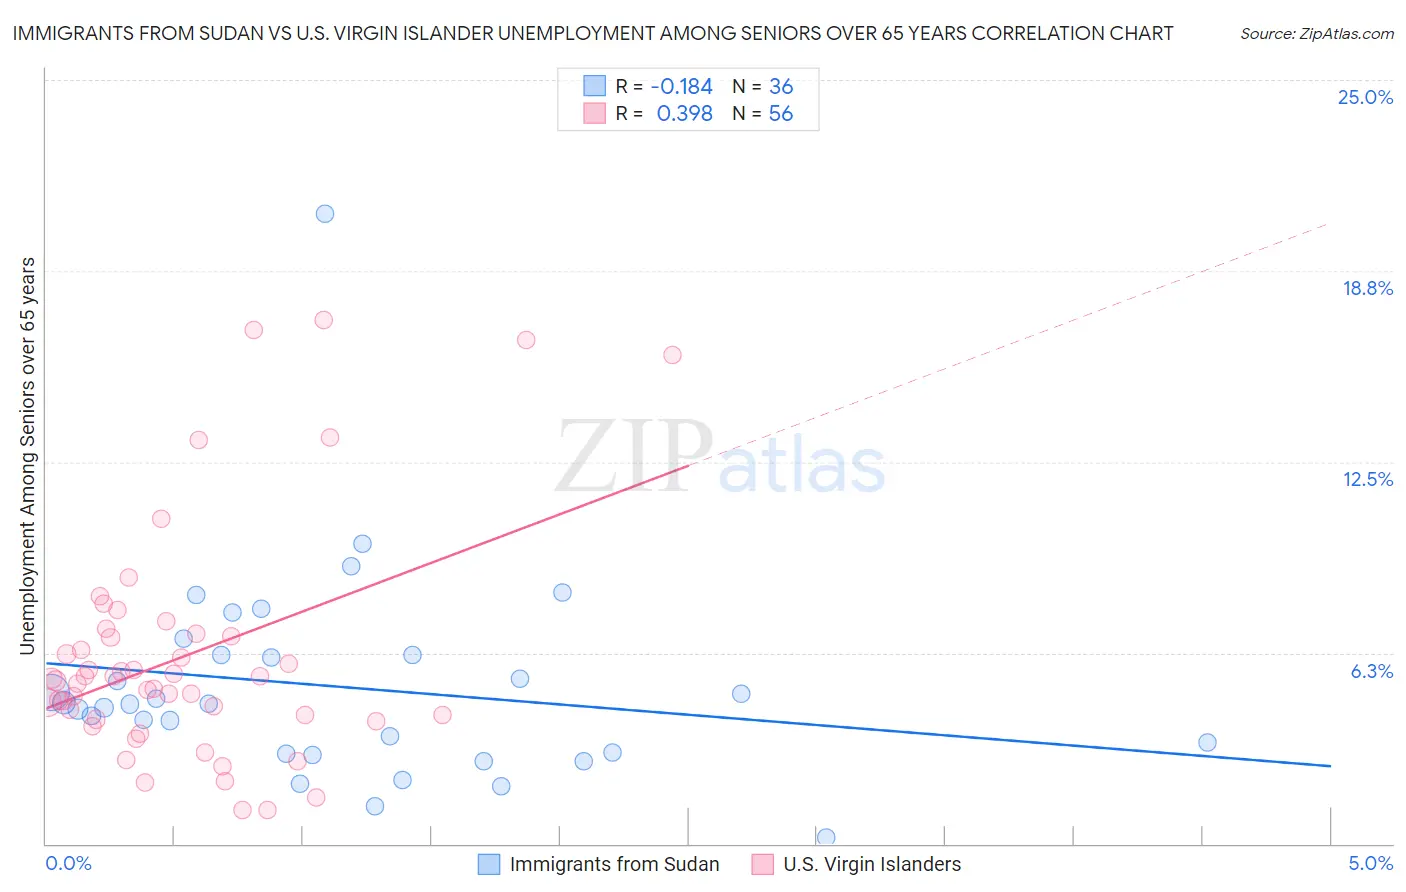
Immigrants from Sudan vs U.S. Virgin Islander Unemployment Among Seniors over 65 years Correlation Chart
The statistical analysis conducted on geographies consisting of 114,887,010 people shows a poor negative correlation between the proportion of Immigrants from Sudan and unemployment rate amomg seniors over the age of 65 in the United States with a correlation coefficient (R) of -0.184 and weighted average of 4.9%. Similarly, the statistical analysis conducted on geographies consisting of 85,139,014 people shows a mild positive correlation between the proportion of U.S. Virgin Islanders and unemployment rate amomg seniors over the age of 65 in the United States with a correlation coefficient (R) of 0.398 and weighted average of 5.5%, a difference of 12.7%.
Unemployment Among Seniors over 65 years Correlation Summary
| Measurement | Immigrants from Sudan | U.S. Virgin Islander |
| Minimum | 0.20% | 1.1% |
| Maximum | 20.6% | 17.1% |
| Range | 20.4% | 16.0% |
| Mean | 5.1% | 6.1% |
| Median | 4.6% | 5.4% |
| Interquartile 25% (IQ1) | 3.0% | 4.1% |
| Interquartile 75% (IQ3) | 6.2% | 6.8% |
| Interquartile Range (IQR) | 3.2% | 2.7% |
| Standard Deviation (Sample) | 3.5% | 3.8% |
| Standard Deviation (Population) | 3.4% | 3.8% |
Similar Demographics by Unemployment Among Seniors over 65 years
Demographics Similar to Immigrants from Sudan by Unemployment Among Seniors over 65 years
In terms of unemployment among seniors over 65 years, the demographic groups most similar to Immigrants from Sudan are Swedish (4.9%, a difference of 0.040%), Scotch-Irish (4.9%, a difference of 0.060%), Immigrants from Iraq (4.9%, a difference of 0.060%), European (4.9%, a difference of 0.070%), and Carpatho Rusyn (4.9%, a difference of 0.13%).
| Demographics | Rating | Rank | Unemployment Among Seniors over 65 years |
| Immigrants | Jordan | 99.9 /100 | #46 | Exceptional 4.9% |
| Germans | 99.9 /100 | #47 | Exceptional 4.9% |
| Choctaw | 99.9 /100 | #48 | Exceptional 4.9% |
| Immigrants | Kenya | 99.9 /100 | #49 | Exceptional 4.9% |
| Immigrants | Austria | 99.9 /100 | #50 | Exceptional 4.9% |
| Scotch-Irish | 99.9 /100 | #51 | Exceptional 4.9% |
| Swedes | 99.9 /100 | #52 | Exceptional 4.9% |
| Immigrants | Sudan | 99.8 /100 | #53 | Exceptional 4.9% |
| Immigrants | Iraq | 99.8 /100 | #54 | Exceptional 4.9% |
| Europeans | 99.8 /100 | #55 | Exceptional 4.9% |
| Carpatho Rusyns | 99.8 /100 | #56 | Exceptional 4.9% |
| Danes | 99.8 /100 | #57 | Exceptional 4.9% |
| Scandinavians | 99.8 /100 | #58 | Exceptional 4.9% |
| Immigrants | Eastern Africa | 99.7 /100 | #59 | Exceptional 4.9% |
| Immigrants | Middle Africa | 99.7 /100 | #60 | Exceptional 4.9% |
Demographics Similar to U.S. Virgin Islanders by Unemployment Among Seniors over 65 years
In terms of unemployment among seniors over 65 years, the demographic groups most similar to U.S. Virgin Islanders are Venezuelan (5.5%, a difference of 0.0%), Immigrants from Barbados (5.5%, a difference of 0.030%), Immigrants from Cabo Verde (5.5%, a difference of 0.030%), Central American (5.5%, a difference of 0.060%), and Immigrants from Liberia (5.5%, a difference of 0.11%).
| Demographics | Rating | Rank | Unemployment Among Seniors over 65 years |
| Immigrants | Norway | 0.0 /100 | #281 | Tragic 5.5% |
| Immigrants | Belize | 0.0 /100 | #282 | Tragic 5.5% |
| Immigrants | Haiti | 0.0 /100 | #283 | Tragic 5.5% |
| Immigrants | Liberia | 0.0 /100 | #284 | Tragic 5.5% |
| Central Americans | 0.0 /100 | #285 | Tragic 5.5% |
| Immigrants | Barbados | 0.0 /100 | #286 | Tragic 5.5% |
| Venezuelans | 0.0 /100 | #287 | Tragic 5.5% |
| U.S. Virgin Islanders | 0.0 /100 | #288 | Tragic 5.5% |
| Immigrants | Cabo Verde | 0.0 /100 | #289 | Tragic 5.5% |
| Jamaicans | 0.0 /100 | #290 | Tragic 5.5% |
| Blacks/African Americans | 0.0 /100 | #291 | Tragic 5.5% |
| Belizeans | 0.0 /100 | #292 | Tragic 5.5% |
| Immigrants | Venezuela | 0.0 /100 | #293 | Tragic 5.5% |
| Armenians | 0.0 /100 | #294 | Tragic 5.5% |
| Cheyenne | 0.0 /100 | #295 | Tragic 5.5% |