Brazilian vs Immigrants from Fiji Seniors Poverty Over the Age of 75
COMPARE
Brazilian
Immigrants from Fiji
Seniors Poverty Over the Age of 75
Seniors Poverty Over the Age of 75 Comparison
Brazilians
Immigrants from Fiji
12.8%
SENIORS POVERTY OVER THE AGE OF 75
6.9/ 100
METRIC RATING
211th/ 347
METRIC RANK
12.2%
SENIORS POVERTY OVER THE AGE OF 75
51.5/ 100
METRIC RATING
172nd/ 347
METRIC RANK
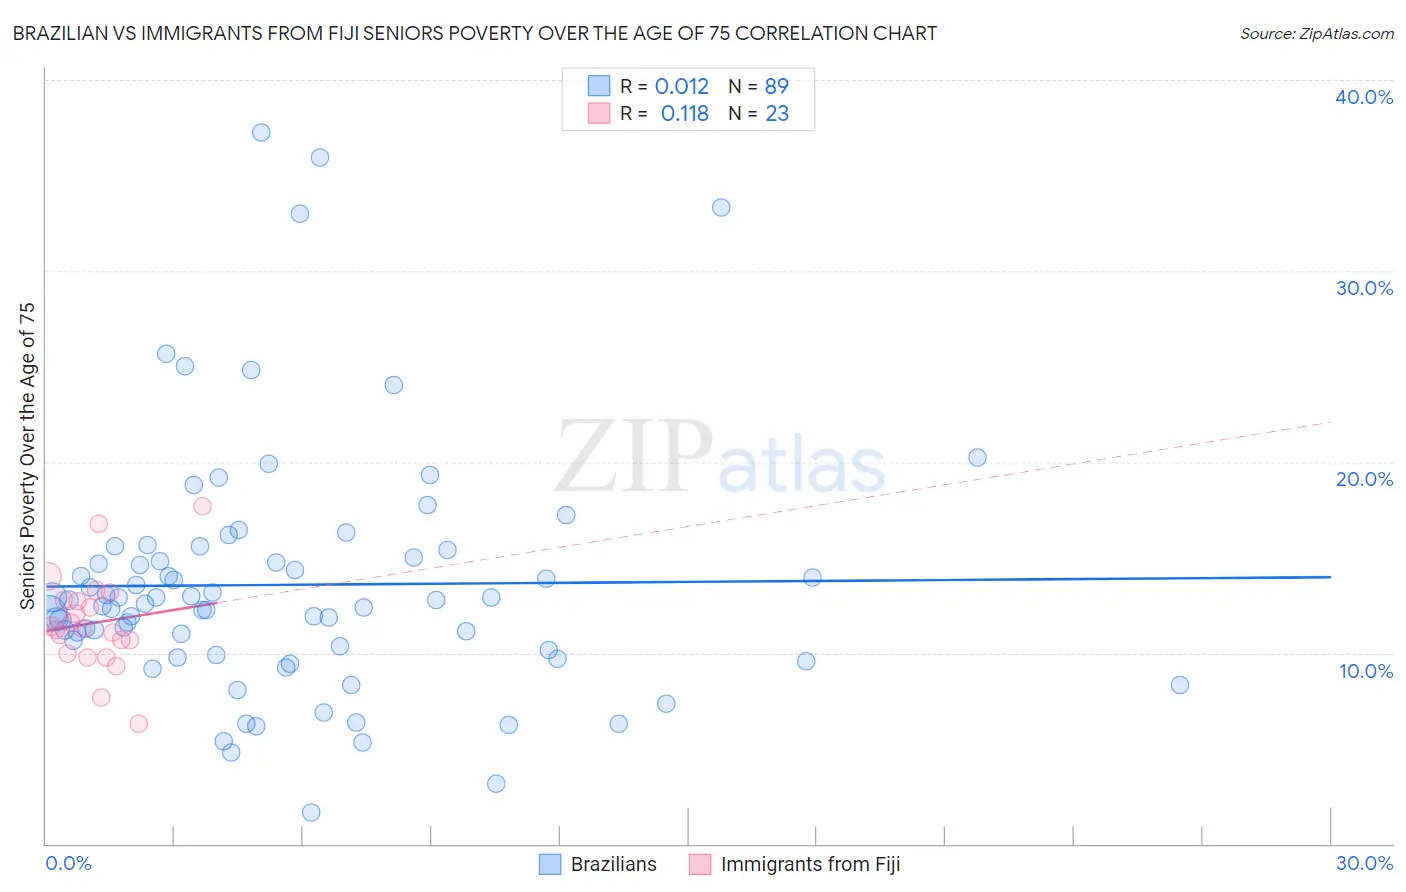
Brazilian vs Immigrants from Fiji Seniors Poverty Over the Age of 75 Correlation Chart
The statistical analysis conducted on geographies consisting of 320,894,327 people shows no correlation between the proportion of Brazilians and poverty level among seniors over the age of 75 in the United States with a correlation coefficient (R) of 0.012 and weighted average of 12.8%. Similarly, the statistical analysis conducted on geographies consisting of 93,526,881 people shows a poor positive correlation between the proportion of Immigrants from Fiji and poverty level among seniors over the age of 75 in the United States with a correlation coefficient (R) of 0.118 and weighted average of 12.2%, a difference of 5.4%.
Seniors Poverty Over the Age of 75 Correlation Summary
| Measurement | Brazilian | Immigrants from Fiji |
| Minimum | 1.6% | 6.3% |
| Maximum | 37.3% | 17.7% |
| Range | 35.6% | 11.4% |
| Mean | 13.6% | 11.6% |
| Median | 12.6% | 11.2% |
| Interquartile 25% (IQ1) | 10.0% | 10.0% |
| Interquartile 75% (IQ3) | 15.2% | 12.8% |
| Interquartile Range (IQR) | 5.2% | 2.8% |
| Standard Deviation (Sample) | 6.5% | 2.5% |
| Standard Deviation (Population) | 6.5% | 2.5% |
Similar Demographics by Seniors Poverty Over the Age of 75
Demographics Similar to Brazilians by Seniors Poverty Over the Age of 75
In terms of seniors poverty over the age of 75, the demographic groups most similar to Brazilians are Comanche (12.8%, a difference of 0.020%), Immigrants from Liberia (12.8%, a difference of 0.12%), Immigrants from Hong Kong (12.8%, a difference of 0.13%), French American Indian (12.9%, a difference of 0.28%), and Immigrants from Africa (12.9%, a difference of 0.35%).
| Demographics | Rating | Rank | Seniors Poverty Over the Age of 75 |
| Immigrants | Eritrea | 10.5 /100 | #204 | Poor 12.7% |
| Indians (Asian) | 9.7 /100 | #205 | Tragic 12.7% |
| Albanians | 9.6 /100 | #206 | Tragic 12.7% |
| Costa Ricans | 8.7 /100 | #207 | Tragic 12.8% |
| Immigrants | Eastern Asia | 8.4 /100 | #208 | Tragic 12.8% |
| Immigrants | Liberia | 7.3 /100 | #209 | Tragic 12.8% |
| Comanche | 7.0 /100 | #210 | Tragic 12.8% |
| Brazilians | 6.9 /100 | #211 | Tragic 12.8% |
| Immigrants | Hong Kong | 6.5 /100 | #212 | Tragic 12.8% |
| French American Indians | 6.1 /100 | #213 | Tragic 12.9% |
| Immigrants | Africa | 5.9 /100 | #214 | Tragic 12.9% |
| South American Indians | 5.5 /100 | #215 | Tragic 12.9% |
| Immigrants | Brazil | 5.2 /100 | #216 | Tragic 12.9% |
| Bermudans | 4.9 /100 | #217 | Tragic 12.9% |
| Immigrants | Western Asia | 4.9 /100 | #218 | Tragic 12.9% |
Demographics Similar to Immigrants from Fiji by Seniors Poverty Over the Age of 75
In terms of seniors poverty over the age of 75, the demographic groups most similar to Immigrants from Fiji are Spaniard (12.2%, a difference of 0.010%), Immigrants from Thailand (12.2%, a difference of 0.040%), Arab (12.2%, a difference of 0.080%), Immigrants from Europe (12.2%, a difference of 0.12%), and Immigrants from Saudi Arabia (12.2%, a difference of 0.17%).
| Demographics | Rating | Rank | Seniors Poverty Over the Age of 75 |
| Okinawans | 56.3 /100 | #165 | Average 12.1% |
| Egyptians | 54.8 /100 | #166 | Average 12.1% |
| Immigrants | Switzerland | 54.5 /100 | #167 | Average 12.1% |
| Immigrants | Syria | 53.9 /100 | #168 | Average 12.2% |
| Immigrants | Egypt | 53.7 /100 | #169 | Average 12.2% |
| Immigrants | Thailand | 52.0 /100 | #170 | Average 12.2% |
| Spaniards | 51.6 /100 | #171 | Average 12.2% |
| Immigrants | Fiji | 51.5 /100 | #172 | Average 12.2% |
| Arabs | 50.5 /100 | #173 | Average 12.2% |
| Immigrants | Europe | 50.0 /100 | #174 | Average 12.2% |
| Immigrants | Saudi Arabia | 49.5 /100 | #175 | Average 12.2% |
| Immigrants | Iran | 48.1 /100 | #176 | Average 12.2% |
| Immigrants | Asia | 47.8 /100 | #177 | Average 12.2% |
| Immigrants | Nonimmigrants | 46.8 /100 | #178 | Average 12.2% |
| Mongolians | 45.5 /100 | #179 | Average 12.2% |