South African vs Immigrants from Fiji Seniors Poverty Over the Age of 75
COMPARE
South African
Immigrants from Fiji
Seniors Poverty Over the Age of 75
Seniors Poverty Over the Age of 75 Comparison
South Africans
Immigrants from Fiji
11.7%
SENIORS POVERTY OVER THE AGE OF 75
89.3/ 100
METRIC RATING
109th/ 347
METRIC RANK
12.2%
SENIORS POVERTY OVER THE AGE OF 75
51.5/ 100
METRIC RATING
172nd/ 347
METRIC RANK
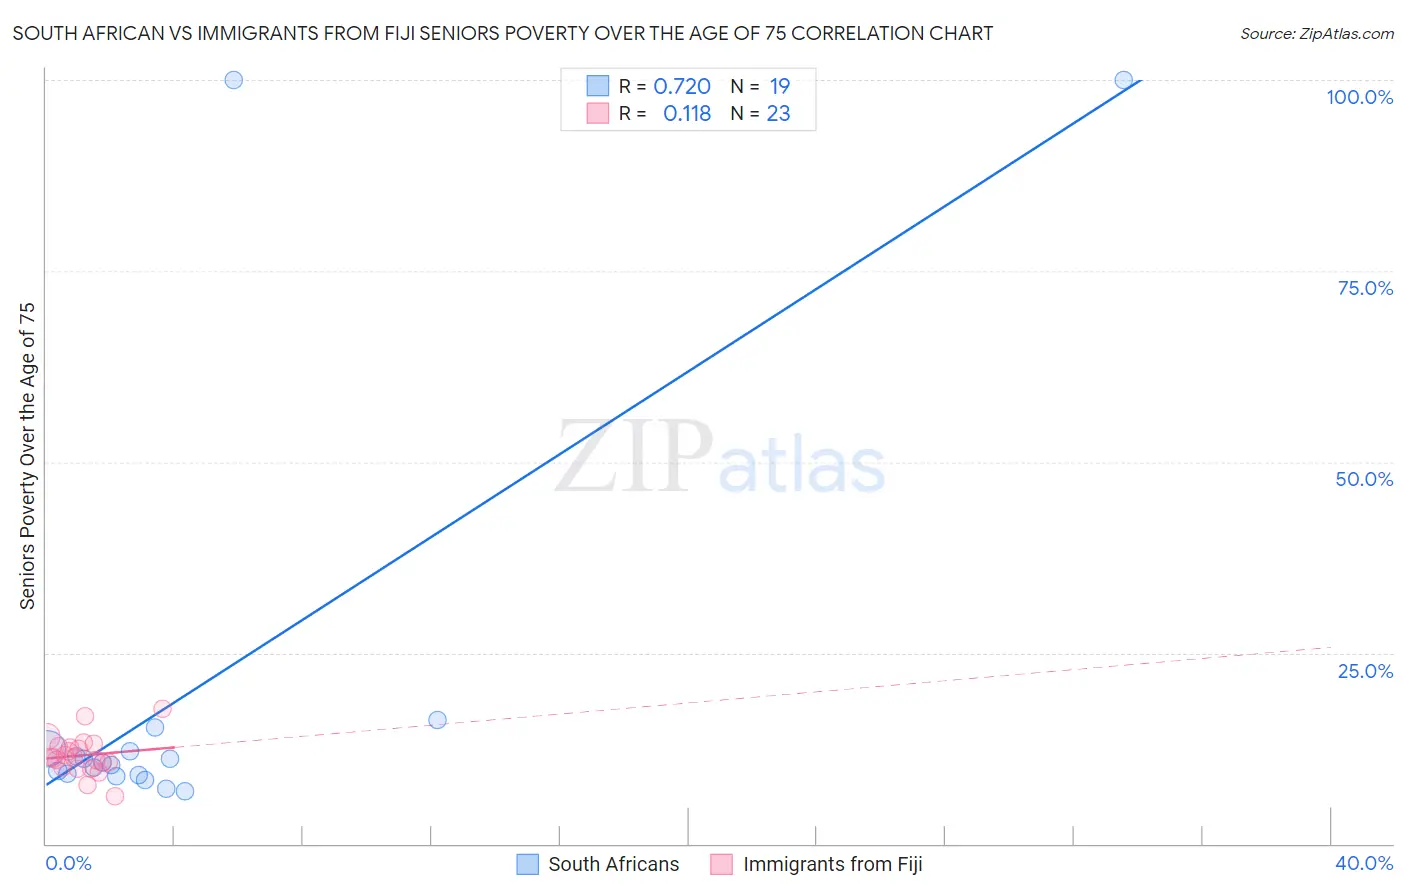
South African vs Immigrants from Fiji Seniors Poverty Over the Age of 75 Correlation Chart
The statistical analysis conducted on geographies consisting of 181,308,648 people shows a strong positive correlation between the proportion of South Africans and poverty level among seniors over the age of 75 in the United States with a correlation coefficient (R) of 0.720 and weighted average of 11.7%. Similarly, the statistical analysis conducted on geographies consisting of 93,526,881 people shows a poor positive correlation between the proportion of Immigrants from Fiji and poverty level among seniors over the age of 75 in the United States with a correlation coefficient (R) of 0.118 and weighted average of 12.2%, a difference of 4.4%.
Seniors Poverty Over the Age of 75 Correlation Summary
| Measurement | South African | Immigrants from Fiji |
| Minimum | 6.9% | 6.3% |
| Maximum | 100.0% | 17.7% |
| Range | 93.1% | 11.4% |
| Mean | 20.0% | 11.6% |
| Median | 10.6% | 11.2% |
| Interquartile 25% (IQ1) | 9.0% | 10.0% |
| Interquartile 75% (IQ3) | 12.5% | 12.8% |
| Interquartile Range (IQR) | 3.5% | 2.8% |
| Standard Deviation (Sample) | 28.3% | 2.5% |
| Standard Deviation (Population) | 27.5% | 2.5% |
Similar Demographics by Seniors Poverty Over the Age of 75
Demographics Similar to South Africans by Seniors Poverty Over the Age of 75
In terms of seniors poverty over the age of 75, the demographic groups most similar to South Africans are Turkish (11.7%, a difference of 0.0%), Immigrants from Oceania (11.7%, a difference of 0.020%), Russian (11.6%, a difference of 0.13%), Immigrants from Jordan (11.7%, a difference of 0.15%), and Burmese (11.7%, a difference of 0.15%).
| Demographics | Rating | Rank | Seniors Poverty Over the Age of 75 |
| Guamanians/Chamorros | 90.6 /100 | #102 | Exceptional 11.6% |
| Immigrants | Kuwait | 90.5 /100 | #103 | Exceptional 11.6% |
| Immigrants | Singapore | 90.3 /100 | #104 | Exceptional 11.6% |
| Chickasaw | 90.2 /100 | #105 | Exceptional 11.6% |
| Russians | 89.9 /100 | #106 | Excellent 11.6% |
| Immigrants | Oceania | 89.4 /100 | #107 | Excellent 11.7% |
| Turks | 89.4 /100 | #108 | Excellent 11.7% |
| South Africans | 89.3 /100 | #109 | Excellent 11.7% |
| Immigrants | Jordan | 88.7 /100 | #110 | Excellent 11.7% |
| Burmese | 88.7 /100 | #111 | Excellent 11.7% |
| Immigrants | Bolivia | 88.4 /100 | #112 | Excellent 11.7% |
| Immigrants | Czechoslovakia | 87.0 /100 | #113 | Excellent 11.7% |
| Ukrainians | 86.9 /100 | #114 | Excellent 11.7% |
| New Zealanders | 86.3 /100 | #115 | Excellent 11.7% |
| Iraqis | 86.3 /100 | #116 | Excellent 11.7% |
Demographics Similar to Immigrants from Fiji by Seniors Poverty Over the Age of 75
In terms of seniors poverty over the age of 75, the demographic groups most similar to Immigrants from Fiji are Spaniard (12.2%, a difference of 0.010%), Immigrants from Thailand (12.2%, a difference of 0.040%), Arab (12.2%, a difference of 0.080%), Immigrants from Europe (12.2%, a difference of 0.12%), and Immigrants from Saudi Arabia (12.2%, a difference of 0.17%).
| Demographics | Rating | Rank | Seniors Poverty Over the Age of 75 |
| Okinawans | 56.3 /100 | #165 | Average 12.1% |
| Egyptians | 54.8 /100 | #166 | Average 12.1% |
| Immigrants | Switzerland | 54.5 /100 | #167 | Average 12.1% |
| Immigrants | Syria | 53.9 /100 | #168 | Average 12.2% |
| Immigrants | Egypt | 53.7 /100 | #169 | Average 12.2% |
| Immigrants | Thailand | 52.0 /100 | #170 | Average 12.2% |
| Spaniards | 51.6 /100 | #171 | Average 12.2% |
| Immigrants | Fiji | 51.5 /100 | #172 | Average 12.2% |
| Arabs | 50.5 /100 | #173 | Average 12.2% |
| Immigrants | Europe | 50.0 /100 | #174 | Average 12.2% |
| Immigrants | Saudi Arabia | 49.5 /100 | #175 | Average 12.2% |
| Immigrants | Iran | 48.1 /100 | #176 | Average 12.2% |
| Immigrants | Asia | 47.8 /100 | #177 | Average 12.2% |
| Immigrants | Nonimmigrants | 46.8 /100 | #178 | Average 12.2% |
| Mongolians | 45.5 /100 | #179 | Average 12.2% |