Immigrants from Sudan vs Zimbabwean Child Poverty Among Boys Under 16
COMPARE
Immigrants from Sudan
Zimbabwean
Child Poverty Among Boys Under 16
Child Poverty Among Boys Under 16 Comparison
Immigrants from Sudan
Zimbabweans
18.8%
CHILD POVERTY AMONG BOYS UNDER 16
0.6/ 100
METRIC RATING
241st/ 347
METRIC RANK
14.3%
CHILD POVERTY AMONG BOYS UNDER 16
99.0/ 100
METRIC RATING
56th/ 347
METRIC RANK
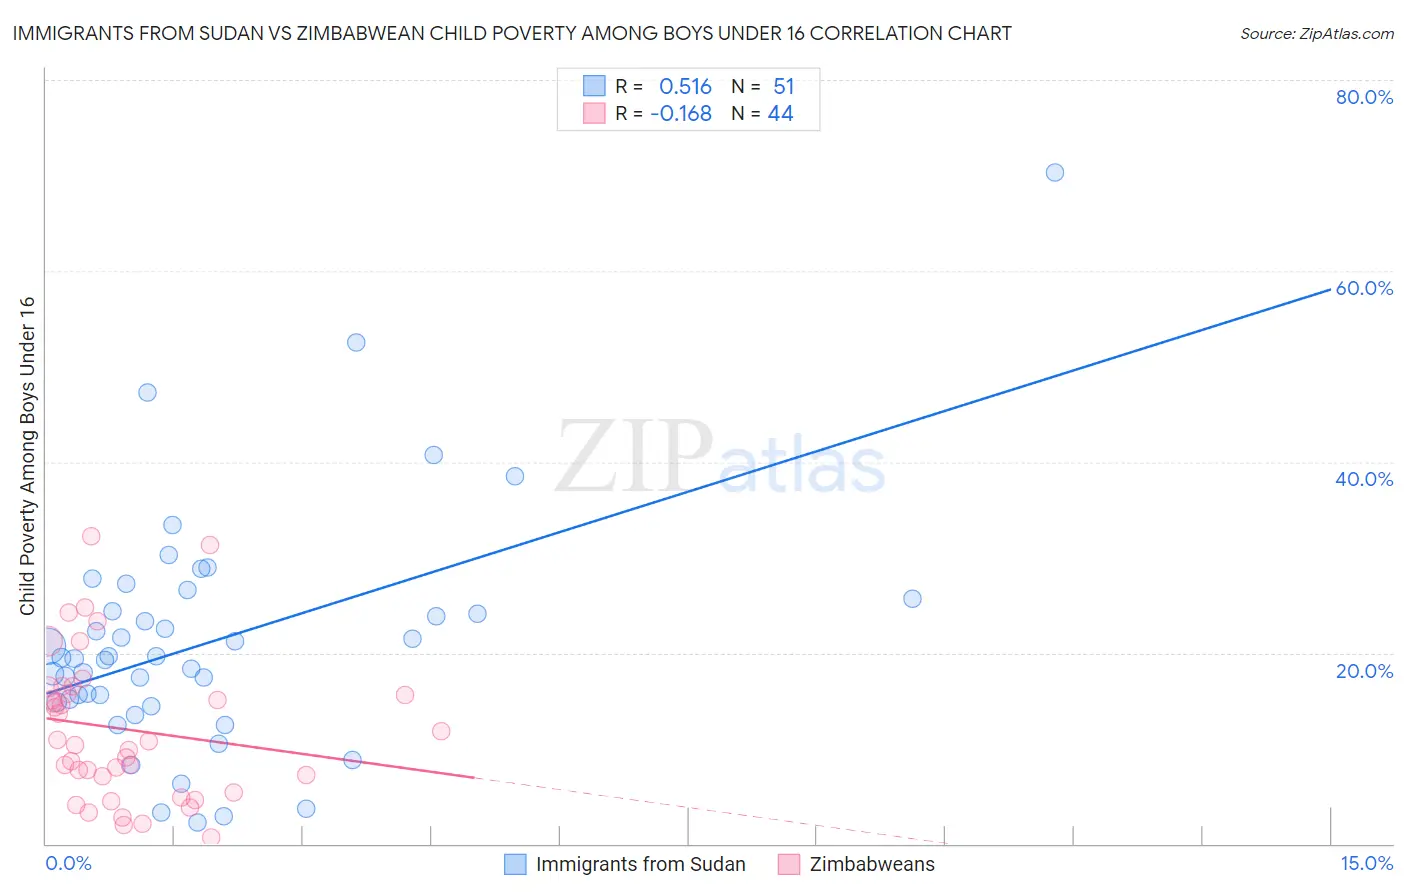
Immigrants from Sudan vs Zimbabwean Child Poverty Among Boys Under 16 Correlation Chart
The statistical analysis conducted on geographies consisting of 118,648,012 people shows a substantial positive correlation between the proportion of Immigrants from Sudan and poverty level among boys under the age of 16 in the United States with a correlation coefficient (R) of 0.516 and weighted average of 18.8%. Similarly, the statistical analysis conducted on geographies consisting of 68,980,540 people shows a poor negative correlation between the proportion of Zimbabweans and poverty level among boys under the age of 16 in the United States with a correlation coefficient (R) of -0.168 and weighted average of 14.3%, a difference of 30.9%.
Child Poverty Among Boys Under 16 Correlation Summary
| Measurement | Immigrants from Sudan | Zimbabwean |
| Minimum | 2.2% | 0.67% |
| Maximum | 70.3% | 32.2% |
| Range | 68.1% | 31.5% |
| Mean | 21.2% | 12.0% |
| Median | 19.4% | 10.6% |
| Interquartile 25% (IQ1) | 14.8% | 6.2% |
| Interquartile 75% (IQ3) | 25.6% | 16.1% |
| Interquartile Range (IQR) | 10.8% | 9.9% |
| Standard Deviation (Sample) | 12.5% | 7.7% |
| Standard Deviation (Population) | 12.3% | 7.6% |
Similar Demographics by Child Poverty Among Boys Under 16
Demographics Similar to Immigrants from Sudan by Child Poverty Among Boys Under 16
In terms of child poverty among boys under 16, the demographic groups most similar to Immigrants from Sudan are Immigrants from Cuba (18.8%, a difference of 0.050%), Cape Verdean (18.7%, a difference of 0.39%), Ghanaian (18.9%, a difference of 0.50%), Immigrants from Laos (18.7%, a difference of 0.63%), and Immigrants from the Azores (18.9%, a difference of 0.84%).
| Demographics | Rating | Rank | Child Poverty Among Boys Under 16 |
| Nigerians | 1.1 /100 | #234 | Tragic 18.5% |
| Americans | 0.9 /100 | #235 | Tragic 18.6% |
| Sudanese | 0.9 /100 | #236 | Tragic 18.6% |
| Immigrants | Eritrea | 0.8 /100 | #237 | Tragic 18.6% |
| Immigrants | Laos | 0.8 /100 | #238 | Tragic 18.7% |
| Cape Verdeans | 0.7 /100 | #239 | Tragic 18.7% |
| Immigrants | Cuba | 0.6 /100 | #240 | Tragic 18.8% |
| Immigrants | Sudan | 0.6 /100 | #241 | Tragic 18.8% |
| Ghanaians | 0.5 /100 | #242 | Tragic 18.9% |
| Immigrants | Azores | 0.4 /100 | #243 | Tragic 18.9% |
| Immigrants | Middle Africa | 0.4 /100 | #244 | Tragic 18.9% |
| Cree | 0.4 /100 | #245 | Tragic 19.0% |
| Immigrants | Nicaragua | 0.4 /100 | #246 | Tragic 19.0% |
| Immigrants | Trinidad and Tobago | 0.3 /100 | #247 | Tragic 19.0% |
| Salvadorans | 0.3 /100 | #248 | Tragic 19.0% |
Demographics Similar to Zimbabweans by Child Poverty Among Boys Under 16
In terms of child poverty among boys under 16, the demographic groups most similar to Zimbabweans are Immigrants from Pakistan (14.3%, a difference of 0.0%), Immigrants from Serbia (14.3%, a difference of 0.050%), Polish (14.4%, a difference of 0.10%), Immigrants from Philippines (14.3%, a difference of 0.13%), and Laotian (14.3%, a difference of 0.17%).
| Demographics | Rating | Rank | Child Poverty Among Boys Under 16 |
| Czechs | 99.3 /100 | #49 | Exceptional 14.1% |
| Italians | 99.2 /100 | #50 | Exceptional 14.2% |
| Immigrants | Greece | 99.2 /100 | #51 | Exceptional 14.2% |
| Laotians | 99.0 /100 | #52 | Exceptional 14.3% |
| Immigrants | Philippines | 99.0 /100 | #53 | Exceptional 14.3% |
| Immigrants | Serbia | 99.0 /100 | #54 | Exceptional 14.3% |
| Immigrants | Pakistan | 99.0 /100 | #55 | Exceptional 14.3% |
| Zimbabweans | 99.0 /100 | #56 | Exceptional 14.3% |
| Poles | 98.9 /100 | #57 | Exceptional 14.4% |
| Immigrants | Sweden | 98.9 /100 | #58 | Exceptional 14.4% |
| Immigrants | Czechoslovakia | 98.9 /100 | #59 | Exceptional 14.4% |
| Immigrants | Belgium | 98.9 /100 | #60 | Exceptional 14.4% |
| Scandinavians | 98.8 /100 | #61 | Exceptional 14.4% |
| Immigrants | Israel | 98.7 /100 | #62 | Exceptional 14.4% |
| Cambodians | 98.5 /100 | #63 | Exceptional 14.5% |