Immigrants from St. Vincent and the Grenadines vs Guamanian/Chamorro Unemployment Among Ages 35 to 44 years
COMPARE
Immigrants from St. Vincent and the Grenadines
Guamanian/Chamorro
Unemployment Among Ages 35 to 44 years
Unemployment Among Ages 35 to 44 years Comparison
Immigrants from St. Vincent and the Grenadines
Guamanians/Chamorros
6.2%
UNEMPLOYMENT AMONG AGES 35 TO 44 YEARS
0.0/ 100
METRIC RATING
317th/ 347
METRIC RANK
5.1%
UNEMPLOYMENT AMONG AGES 35 TO 44 YEARS
0.9/ 100
METRIC RATING
235th/ 347
METRIC RANK
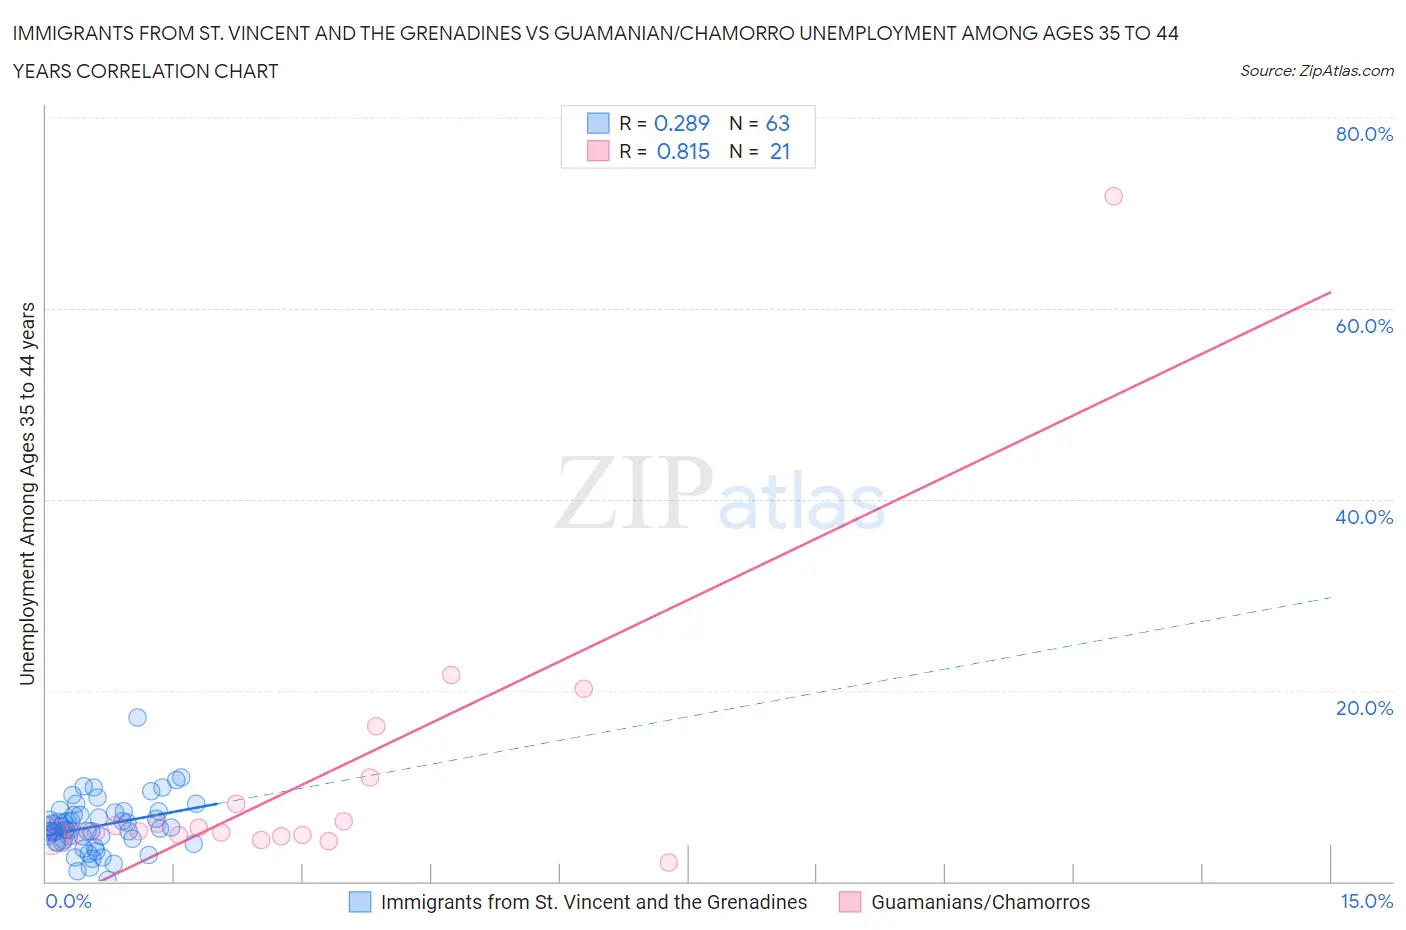
Immigrants from St. Vincent and the Grenadines vs Guamanian/Chamorro Unemployment Among Ages 35 to 44 years Correlation Chart
The statistical analysis conducted on geographies consisting of 56,040,595 people shows a weak positive correlation between the proportion of Immigrants from St. Vincent and the Grenadines and unemployment rate among population between the ages 35 and 44 in the United States with a correlation coefficient (R) of 0.289 and weighted average of 6.2%. Similarly, the statistical analysis conducted on geographies consisting of 219,585,271 people shows a very strong positive correlation between the proportion of Guamanians/Chamorros and unemployment rate among population between the ages 35 and 44 in the United States with a correlation coefficient (R) of 0.815 and weighted average of 5.1%, a difference of 21.5%.
Unemployment Among Ages 35 to 44 years Correlation Summary
| Measurement | Immigrants from St. Vincent and the Grenadines | Guamanian/Chamorro |
| Minimum | 0.10% | 1.9% |
| Maximum | 17.1% | 71.7% |
| Range | 17.0% | 69.8% |
| Mean | 5.8% | 10.6% |
| Median | 5.4% | 5.2% |
| Interquartile 25% (IQ1) | 4.0% | 4.8% |
| Interquartile 75% (IQ3) | 6.9% | 9.5% |
| Interquartile Range (IQR) | 2.9% | 4.7% |
| Standard Deviation (Sample) | 2.7% | 15.0% |
| Standard Deviation (Population) | 2.7% | 14.6% |
Similar Demographics by Unemployment Among Ages 35 to 44 years
Demographics Similar to Immigrants from St. Vincent and the Grenadines by Unemployment Among Ages 35 to 44 years
In terms of unemployment among ages 35 to 44 years, the demographic groups most similar to Immigrants from St. Vincent and the Grenadines are Tsimshian (6.2%, a difference of 0.19%), Colville (6.2%, a difference of 0.41%), Immigrants from Grenada (6.2%, a difference of 0.67%), Immigrants from Armenia (6.2%, a difference of 0.91%), and Chippewa (6.2%, a difference of 0.97%).
| Demographics | Rating | Rank | Unemployment Among Ages 35 to 44 years |
| Guyanese | 0.0 /100 | #310 | Tragic 5.9% |
| Marshallese | 0.0 /100 | #311 | Tragic 5.9% |
| Immigrants | Guyana | 0.0 /100 | #312 | Tragic 6.0% |
| British West Indians | 0.0 /100 | #313 | Tragic 6.0% |
| Immigrants | Dominica | 0.0 /100 | #314 | Tragic 6.0% |
| Blacks/African Americans | 0.0 /100 | #315 | Tragic 6.1% |
| Tsimshian | 0.0 /100 | #316 | Tragic 6.2% |
| Immigrants | St. Vincent and the Grenadines | 0.0 /100 | #317 | Tragic 6.2% |
| Colville | 0.0 /100 | #318 | Tragic 6.2% |
| Immigrants | Grenada | 0.0 /100 | #319 | Tragic 6.2% |
| Immigrants | Armenia | 0.0 /100 | #320 | Tragic 6.2% |
| Chippewa | 0.0 /100 | #321 | Tragic 6.2% |
| Immigrants | Dominican Republic | 0.0 /100 | #322 | Tragic 6.4% |
| Dominicans | 0.0 /100 | #323 | Tragic 6.4% |
| Menominee | 0.0 /100 | #324 | Tragic 6.5% |
Demographics Similar to Guamanians/Chamorros by Unemployment Among Ages 35 to 44 years
In terms of unemployment among ages 35 to 44 years, the demographic groups most similar to Guamanians/Chamorros are Central American (5.1%, a difference of 0.21%), Portuguese (5.1%, a difference of 0.26%), Kiowa (5.1%, a difference of 0.26%), Immigrants from Nigeria (5.1%, a difference of 0.33%), and Iroquois (5.1%, a difference of 0.38%).
| Demographics | Rating | Rank | Unemployment Among Ages 35 to 44 years |
| Samoans | 1.8 /100 | #228 | Tragic 5.0% |
| Immigrants | Cambodia | 1.5 /100 | #229 | Tragic 5.0% |
| Liberians | 1.3 /100 | #230 | Tragic 5.1% |
| Japanese | 1.2 /100 | #231 | Tragic 5.1% |
| Iroquois | 1.2 /100 | #232 | Tragic 5.1% |
| Immigrants | Nigeria | 1.2 /100 | #233 | Tragic 5.1% |
| Portuguese | 1.1 /100 | #234 | Tragic 5.1% |
| Guamanians/Chamorros | 0.9 /100 | #235 | Tragic 5.1% |
| Central Americans | 0.8 /100 | #236 | Tragic 5.1% |
| Kiowa | 0.8 /100 | #237 | Tragic 5.1% |
| Hondurans | 0.7 /100 | #238 | Tragic 5.1% |
| Nigerians | 0.7 /100 | #239 | Tragic 5.1% |
| Somalis | 0.7 /100 | #240 | Tragic 5.1% |
| Immigrants | Honduras | 0.6 /100 | #241 | Tragic 5.1% |
| Delaware | 0.5 /100 | #242 | Tragic 5.1% |