Immigrants from St. Vincent and the Grenadines vs Guamanian/Chamorro 9th Grade
COMPARE
Immigrants from St. Vincent and the Grenadines
Guamanian/Chamorro
9th Grade
9th Grade Comparison
Immigrants from St. Vincent and the Grenadines
Guamanians/Chamorros
93.4%
9TH GRADE
0.0/ 100
METRIC RATING
287th/ 347
METRIC RANK
94.8%
9TH GRADE
35.5/ 100
METRIC RATING
187th/ 347
METRIC RANK
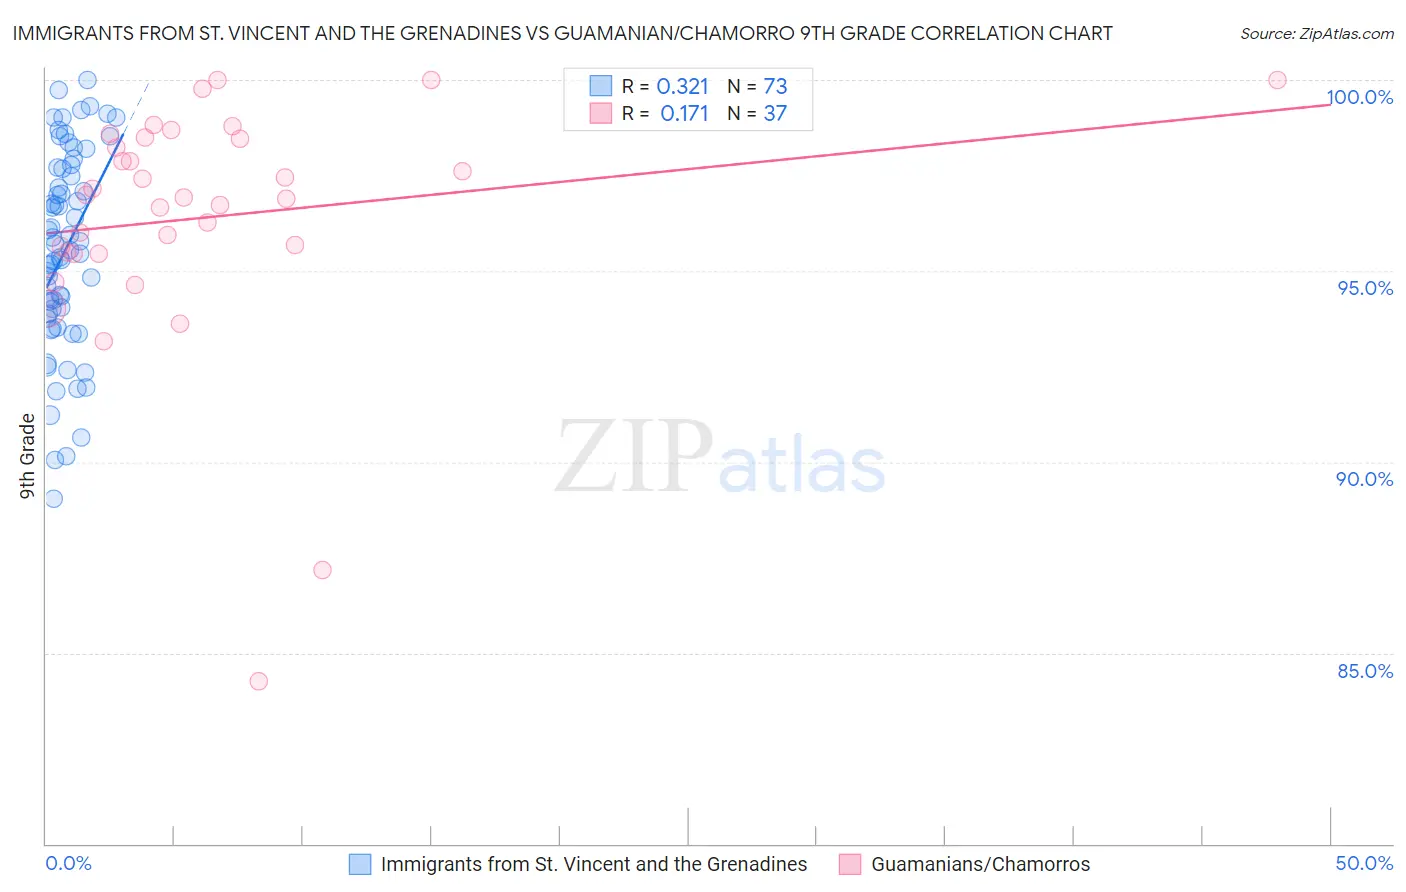
Immigrants from St. Vincent and the Grenadines vs Guamanian/Chamorro 9th Grade Correlation Chart
The statistical analysis conducted on geographies consisting of 56,191,418 people shows a mild positive correlation between the proportion of Immigrants from St. Vincent and the Grenadines and percentage of population with at least 9th grade education in the United States with a correlation coefficient (R) of 0.321 and weighted average of 93.4%. Similarly, the statistical analysis conducted on geographies consisting of 221,965,618 people shows a poor positive correlation between the proportion of Guamanians/Chamorros and percentage of population with at least 9th grade education in the United States with a correlation coefficient (R) of 0.171 and weighted average of 94.8%, a difference of 1.5%.
9th Grade Correlation Summary
| Measurement | Immigrants from St. Vincent and the Grenadines | Guamanian/Chamorro |
| Minimum | 89.0% | 84.3% |
| Maximum | 100.0% | 100.0% |
| Range | 11.0% | 15.7% |
| Mean | 95.5% | 96.4% |
| Median | 95.5% | 96.9% |
| Interquartile 25% (IQ1) | 93.8% | 95.5% |
| Interquartile 75% (IQ3) | 97.7% | 98.5% |
| Interquartile Range (IQR) | 3.9% | 3.0% |
| Standard Deviation (Sample) | 2.6% | 3.2% |
| Standard Deviation (Population) | 2.6% | 3.1% |
Similar Demographics by 9th Grade
Demographics Similar to Immigrants from St. Vincent and the Grenadines by 9th Grade
In terms of 9th grade, the demographic groups most similar to Immigrants from St. Vincent and the Grenadines are Immigrants from Barbados (93.4%, a difference of 0.010%), Immigrants from South Eastern Asia (93.3%, a difference of 0.030%), Immigrants from Peru (93.4%, a difference of 0.040%), Bangladeshi (93.4%, a difference of 0.090%), and Immigrants from West Indies (93.3%, a difference of 0.090%).
| Demographics | Rating | Rank | 9th Grade |
| Taiwanese | 0.1 /100 | #280 | Tragic 93.6% |
| Immigrants | Trinidad and Tobago | 0.1 /100 | #281 | Tragic 93.6% |
| Malaysians | 0.0 /100 | #282 | Tragic 93.5% |
| Barbadians | 0.0 /100 | #283 | Tragic 93.5% |
| Bangladeshis | 0.0 /100 | #284 | Tragic 93.4% |
| Immigrants | Peru | 0.0 /100 | #285 | Tragic 93.4% |
| Immigrants | Barbados | 0.0 /100 | #286 | Tragic 93.4% |
| Immigrants | St. Vincent and the Grenadines | 0.0 /100 | #287 | Tragic 93.4% |
| Immigrants | South Eastern Asia | 0.0 /100 | #288 | Tragic 93.3% |
| Immigrants | West Indies | 0.0 /100 | #289 | Tragic 93.3% |
| Pennsylvania Germans | 0.0 /100 | #290 | Tragic 93.3% |
| British West Indians | 0.0 /100 | #291 | Tragic 93.2% |
| Immigrants | Laos | 0.0 /100 | #292 | Tragic 93.2% |
| Sri Lankans | 0.0 /100 | #293 | Tragic 93.2% |
| Cubans | 0.0 /100 | #294 | Tragic 93.2% |
Demographics Similar to Guamanians/Chamorros by 9th Grade
In terms of 9th grade, the demographic groups most similar to Guamanians/Chamorros are Hopi (94.8%, a difference of 0.010%), Immigrants from Albania (94.8%, a difference of 0.010%), Immigrants from Argentina (94.8%, a difference of 0.010%), Argentinean (94.8%, a difference of 0.020%), and Liberian (94.8%, a difference of 0.020%).
| Demographics | Rating | Rank | 9th Grade |
| Immigrants | Uganda | 43.1 /100 | #180 | Average 94.8% |
| Sierra Leoneans | 42.7 /100 | #181 | Average 94.8% |
| Seminole | 42.5 /100 | #182 | Average 94.8% |
| Immigrants | Nepal | 39.7 /100 | #183 | Fair 94.8% |
| Argentineans | 37.6 /100 | #184 | Fair 94.8% |
| Liberians | 37.4 /100 | #185 | Fair 94.8% |
| Hopi | 37.1 /100 | #186 | Fair 94.8% |
| Guamanians/Chamorros | 35.5 /100 | #187 | Fair 94.8% |
| Immigrants | Albania | 34.5 /100 | #188 | Fair 94.8% |
| Immigrants | Argentina | 34.4 /100 | #189 | Fair 94.8% |
| Sudanese | 32.7 /100 | #190 | Fair 94.7% |
| Assyrians/Chaldeans/Syriacs | 32.0 /100 | #191 | Fair 94.7% |
| Immigrants | Northern Africa | 30.7 /100 | #192 | Fair 94.7% |
| Paraguayans | 30.1 /100 | #193 | Fair 94.7% |
| Panamanians | 29.0 /100 | #194 | Fair 94.7% |