Immigrants from St. Vincent and the Grenadines vs Immigrants from Trinidad and Tobago Single Female Poverty
COMPARE
Immigrants from St. Vincent and the Grenadines
Immigrants from Trinidad and Tobago
Single Female Poverty
Single Female Poverty Comparison
Immigrants from St. Vincent and the Grenadines
Immigrants from Trinidad and Tobago
21.7%
SINGLE FEMALE POVERTY
11.7/ 100
METRIC RATING
217th/ 347
METRIC RANK
20.9%
SINGLE FEMALE POVERTY
56.3/ 100
METRIC RATING
169th/ 347
METRIC RANK
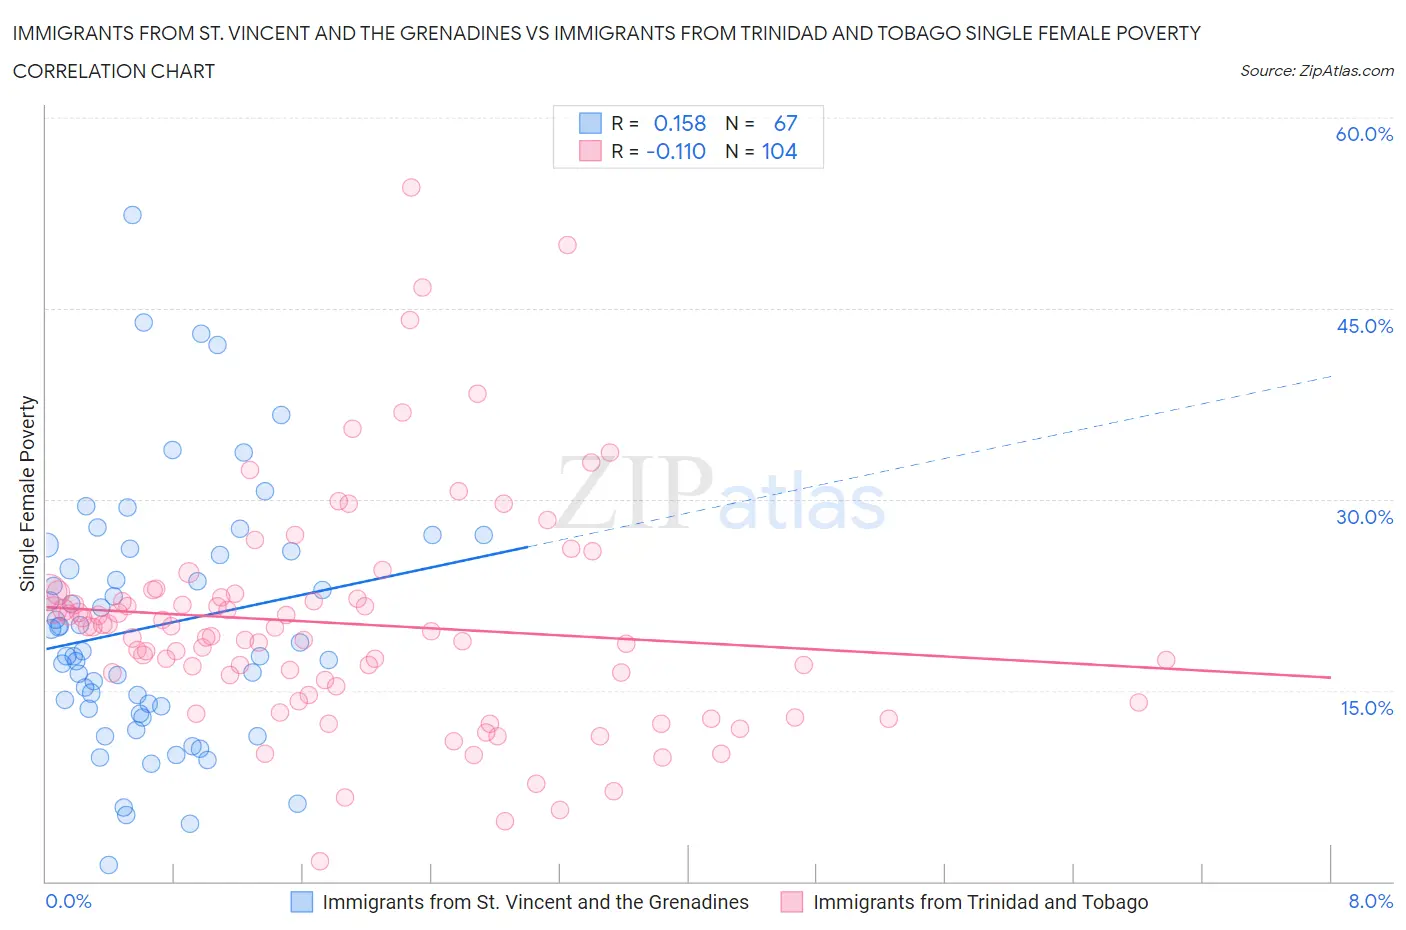
Immigrants from St. Vincent and the Grenadines vs Immigrants from Trinidad and Tobago Single Female Poverty Correlation Chart
The statistical analysis conducted on geographies consisting of 56,125,739 people shows a poor positive correlation between the proportion of Immigrants from St. Vincent and the Grenadines and poverty level among single females in the United States with a correlation coefficient (R) of 0.158 and weighted average of 21.7%. Similarly, the statistical analysis conducted on geographies consisting of 221,570,063 people shows a poor negative correlation between the proportion of Immigrants from Trinidad and Tobago and poverty level among single females in the United States with a correlation coefficient (R) of -0.110 and weighted average of 20.9%, a difference of 3.5%.
Single Female Poverty Correlation Summary
| Measurement | Immigrants from St. Vincent and the Grenadines | Immigrants from Trinidad and Tobago |
| Minimum | 1.3% | 1.5% |
| Maximum | 52.4% | 54.5% |
| Range | 51.1% | 53.0% |
| Mean | 20.1% | 20.2% |
| Median | 18.1% | 19.4% |
| Interquartile 25% (IQ1) | 13.5% | 15.0% |
| Interquartile 75% (IQ3) | 25.9% | 22.4% |
| Interquartile Range (IQR) | 12.3% | 7.5% |
| Standard Deviation (Sample) | 9.9% | 8.9% |
| Standard Deviation (Population) | 9.8% | 8.9% |
Similar Demographics by Single Female Poverty
Demographics Similar to Immigrants from St. Vincent and the Grenadines by Single Female Poverty
In terms of single female poverty, the demographic groups most similar to Immigrants from St. Vincent and the Grenadines are Immigrants from Barbados (21.7%, a difference of 0.060%), Ecuadorian (21.6%, a difference of 0.090%), Immigrants from Nicaragua (21.6%, a difference of 0.22%), Guamanian/Chamorro (21.6%, a difference of 0.28%), and Jamaican (21.6%, a difference of 0.30%).
| Demographics | Rating | Rank | Single Female Poverty |
| Immigrants | Panama | 14.4 /100 | #210 | Poor 21.6% |
| Icelanders | 14.0 /100 | #211 | Poor 21.6% |
| Jamaicans | 14.0 /100 | #212 | Poor 21.6% |
| Guamanians/Chamorros | 13.7 /100 | #213 | Poor 21.6% |
| Immigrants | Nicaragua | 13.3 /100 | #214 | Poor 21.6% |
| Ecuadorians | 12.3 /100 | #215 | Poor 21.6% |
| Immigrants | Barbados | 12.2 /100 | #216 | Poor 21.7% |
| Immigrants | St. Vincent and the Grenadines | 11.7 /100 | #217 | Poor 21.7% |
| Nepalese | 9.7 /100 | #218 | Tragic 21.7% |
| Panamanians | 9.4 /100 | #219 | Tragic 21.7% |
| Germans | 8.3 /100 | #220 | Tragic 21.8% |
| Immigrants | Grenada | 8.0 /100 | #221 | Tragic 21.8% |
| Immigrants | Eritrea | 7.9 /100 | #222 | Tragic 21.8% |
| Scottish | 7.3 /100 | #223 | Tragic 21.8% |
| Barbadians | 7.2 /100 | #224 | Tragic 21.8% |
Demographics Similar to Immigrants from Trinidad and Tobago by Single Female Poverty
In terms of single female poverty, the demographic groups most similar to Immigrants from Trinidad and Tobago are New Zealander (21.0%, a difference of 0.20%), Moroccan (21.0%, a difference of 0.22%), Guyanese (21.0%, a difference of 0.27%), Immigrants from Costa Rica (20.9%, a difference of 0.34%), and Immigrants from Guyana (21.0%, a difference of 0.36%).
| Demographics | Rating | Rank | Single Female Poverty |
| Northern Europeans | 68.4 /100 | #162 | Good 20.8% |
| Lebanese | 67.6 /100 | #163 | Good 20.8% |
| Iraqis | 64.5 /100 | #164 | Good 20.8% |
| Ugandans | 64.0 /100 | #165 | Good 20.8% |
| Norwegians | 63.0 /100 | #166 | Good 20.8% |
| Immigrants | Norway | 63.0 /100 | #167 | Good 20.8% |
| Immigrants | Costa Rica | 61.5 /100 | #168 | Good 20.9% |
| Immigrants | Trinidad and Tobago | 56.3 /100 | #169 | Average 20.9% |
| New Zealanders | 53.2 /100 | #170 | Average 21.0% |
| Moroccans | 52.8 /100 | #171 | Average 21.0% |
| Guyanese | 52.0 /100 | #172 | Average 21.0% |
| Immigrants | Guyana | 50.6 /100 | #173 | Average 21.0% |
| Cubans | 50.0 /100 | #174 | Average 21.0% |
| Czechs | 46.8 /100 | #175 | Average 21.0% |
| Canadians | 45.4 /100 | #176 | Average 21.1% |