Immigrants from Israel vs French Canadian Poverty
COMPARE
Immigrants from Israel
French Canadian
Poverty
Poverty Comparison
Immigrants from Israel
French Canadians
11.7%
POVERTY
87.4/ 100
METRIC RATING
128th/ 347
METRIC RANK
11.6%
POVERTY
91.0/ 100
METRIC RATING
111th/ 347
METRIC RANK
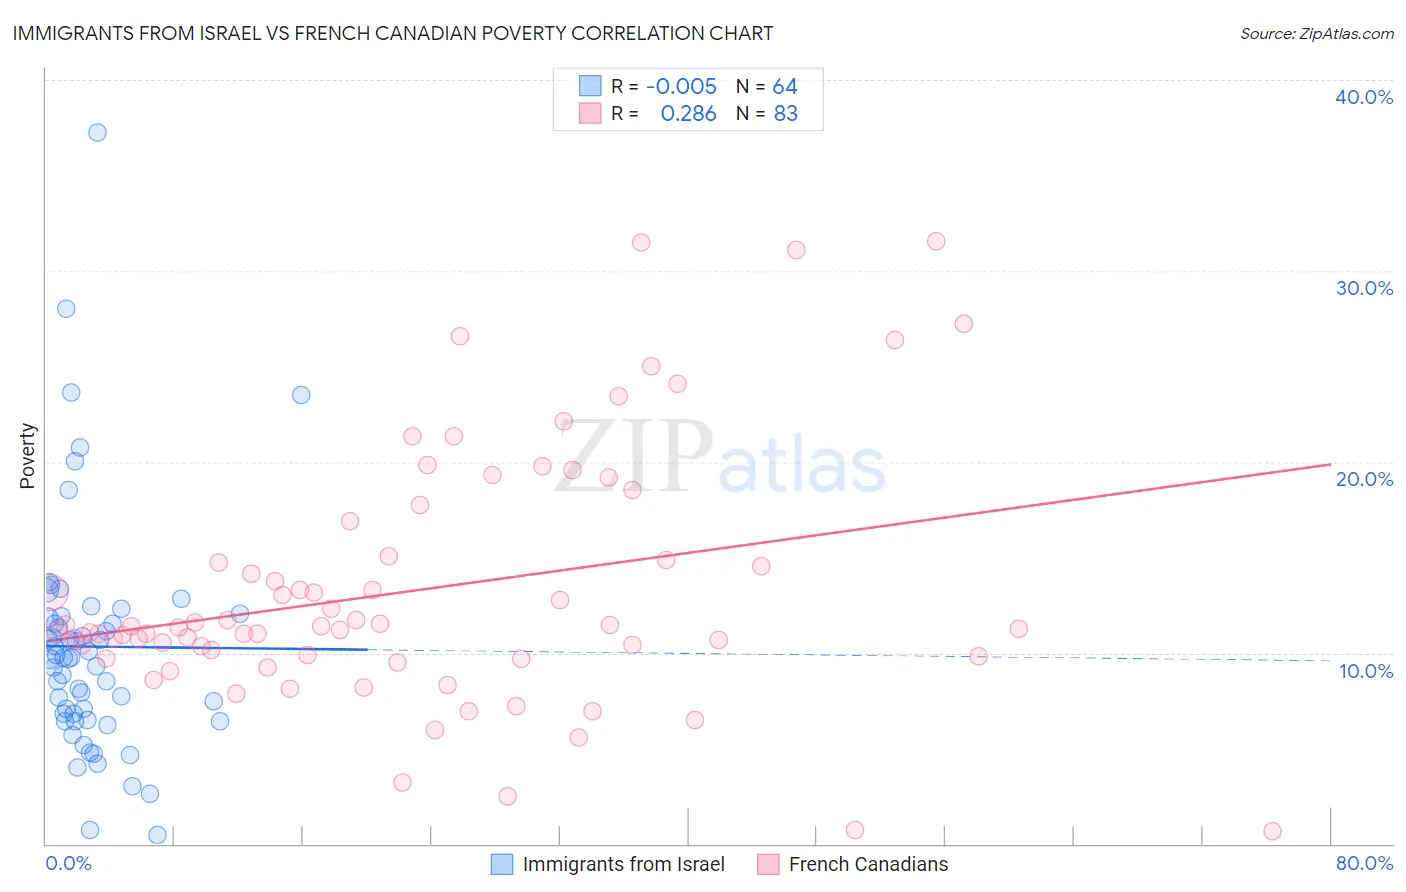
Immigrants from Israel vs French Canadian Poverty Correlation Chart
The statistical analysis conducted on geographies consisting of 209,974,563 people shows no correlation between the proportion of Immigrants from Israel and poverty level in the United States with a correlation coefficient (R) of -0.005 and weighted average of 11.7%. Similarly, the statistical analysis conducted on geographies consisting of 502,211,905 people shows a weak positive correlation between the proportion of French Canadians and poverty level in the United States with a correlation coefficient (R) of 0.286 and weighted average of 11.6%, a difference of 0.97%.
Poverty Correlation Summary
| Measurement | Immigrants from Israel | French Canadian |
| Minimum | 0.47% | 0.65% |
| Maximum | 37.3% | 31.6% |
| Range | 36.8% | 30.9% |
| Mean | 10.3% | 13.3% |
| Median | 9.7% | 11.3% |
| Interquartile 25% (IQ1) | 6.6% | 9.8% |
| Interquartile 75% (IQ3) | 11.9% | 15.1% |
| Interquartile Range (IQR) | 5.2% | 5.3% |
| Standard Deviation (Sample) | 6.2% | 6.6% |
| Standard Deviation (Population) | 6.1% | 6.5% |
Demographics Similar to Immigrants from Israel and French Canadians by Poverty
In terms of poverty, the demographic groups most similar to Immigrants from Israel are South African (11.7%, a difference of 0.090%), Immigrants from Argentina (11.7%, a difference of 0.13%), Immigrants from Norway (11.7%, a difference of 0.14%), Immigrants from Brazil (11.7%, a difference of 0.18%), and Soviet Union (11.7%, a difference of 0.22%). Similarly, the demographic groups most similar to French Canadians are Immigrants from Southern Europe (11.6%, a difference of 0.070%), Immigrants from Belarus (11.6%, a difference of 0.070%), Immigrants from China (11.6%, a difference of 0.090%), Welsh (11.6%, a difference of 0.17%), and Immigrants from Turkey (11.6%, a difference of 0.21%).
| Demographics | Rating | Rank | Poverty |
| Immigrants | Turkey | 91.7 /100 | #109 | Exceptional 11.6% |
| Welsh | 91.6 /100 | #110 | Exceptional 11.6% |
| French Canadians | 91.0 /100 | #111 | Exceptional 11.6% |
| Immigrants | Southern Europe | 90.8 /100 | #112 | Exceptional 11.6% |
| Immigrants | Belarus | 90.8 /100 | #113 | Exceptional 11.6% |
| Immigrants | China | 90.7 /100 | #114 | Exceptional 11.6% |
| Albanians | 90.3 /100 | #115 | Exceptional 11.7% |
| Immigrants | Russia | 89.7 /100 | #116 | Excellent 11.7% |
| Sri Lankans | 89.4 /100 | #117 | Excellent 11.7% |
| Argentineans | 89.1 /100 | #118 | Excellent 11.7% |
| Tlingit-Haida | 89.0 /100 | #119 | Excellent 11.7% |
| Immigrants | South Eastern Asia | 88.9 /100 | #120 | Excellent 11.7% |
| New Zealanders | 88.7 /100 | #121 | Excellent 11.7% |
| Puget Sound Salish | 88.7 /100 | #122 | Excellent 11.7% |
| Immigrants | Hungary | 88.6 /100 | #123 | Excellent 11.7% |
| Soviet Union | 88.4 /100 | #124 | Excellent 11.7% |
| Immigrants | Brazil | 88.2 /100 | #125 | Excellent 11.7% |
| Immigrants | Norway | 88.0 /100 | #126 | Excellent 11.7% |
| Immigrants | Argentina | 88.0 /100 | #127 | Excellent 11.7% |
| Immigrants | Israel | 87.4 /100 | #128 | Excellent 11.7% |
| South Africans | 87.0 /100 | #129 | Excellent 11.7% |