Immigrants from Sri Lanka vs American Child Poverty Among Boys Under 16
COMPARE
Immigrants from Sri Lanka
American
Child Poverty Among Boys Under 16
Child Poverty Among Boys Under 16 Comparison
Immigrants from Sri Lanka
Americans
13.9%
CHILD POVERTY AMONG BOYS UNDER 16
99.6/ 100
METRIC RATING
37th/ 347
METRIC RANK
18.6%
CHILD POVERTY AMONG BOYS UNDER 16
0.9/ 100
METRIC RATING
235th/ 347
METRIC RANK
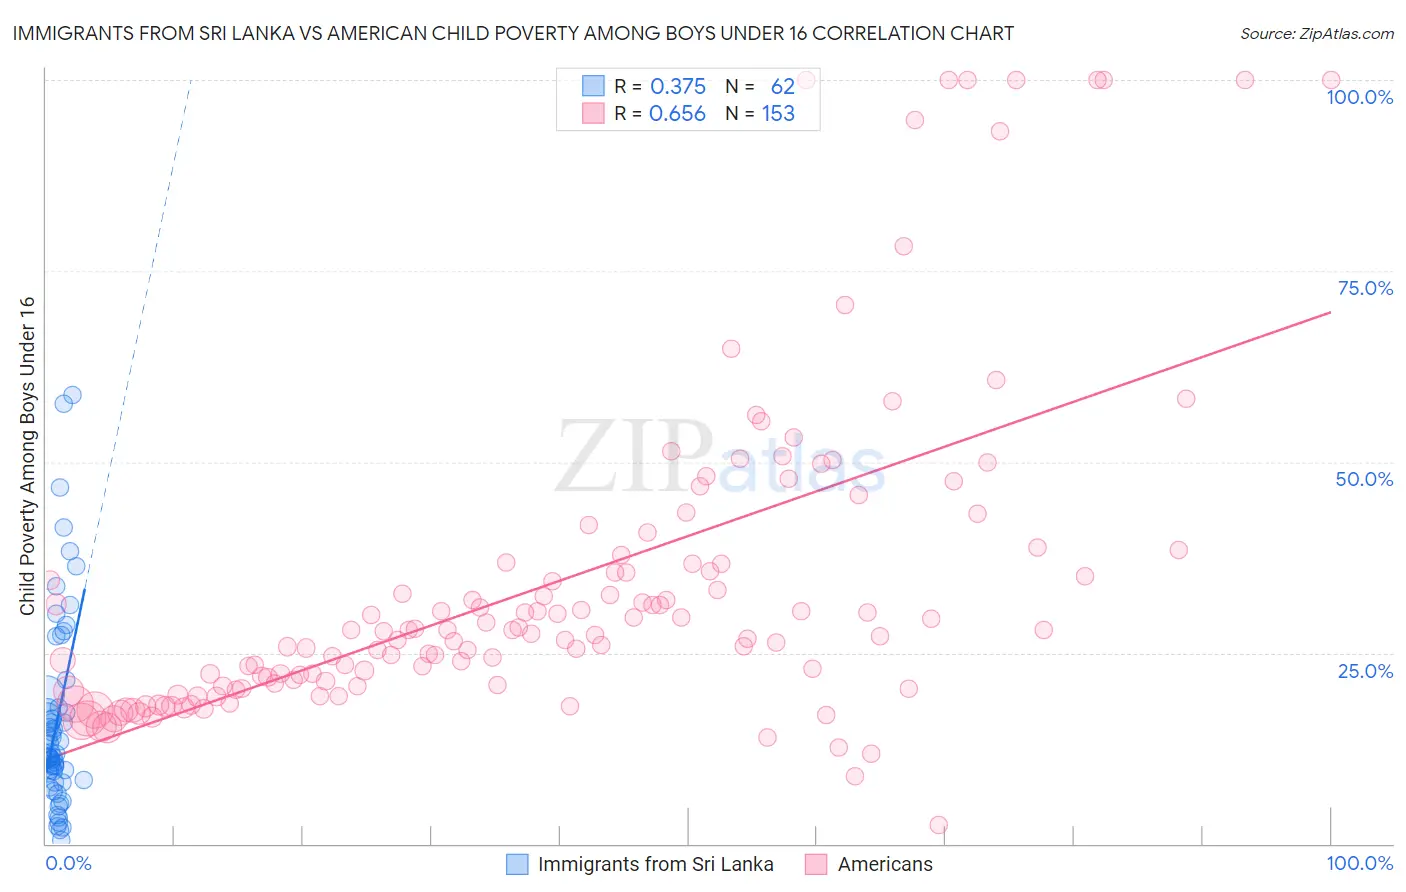
Immigrants from Sri Lanka vs American Child Poverty Among Boys Under 16 Correlation Chart
The statistical analysis conducted on geographies consisting of 148,658,821 people shows a mild positive correlation between the proportion of Immigrants from Sri Lanka and poverty level among boys under the age of 16 in the United States with a correlation coefficient (R) of 0.375 and weighted average of 13.9%. Similarly, the statistical analysis conducted on geographies consisting of 559,344,649 people shows a significant positive correlation between the proportion of Americans and poverty level among boys under the age of 16 in the United States with a correlation coefficient (R) of 0.656 and weighted average of 18.6%, a difference of 34.0%.
Child Poverty Among Boys Under 16 Correlation Summary
| Measurement | Immigrants from Sri Lanka | American |
| Minimum | 0.42% | 2.5% |
| Maximum | 58.8% | 100.0% |
| Range | 58.4% | 97.5% |
| Mean | 16.1% | 33.9% |
| Median | 11.5% | 27.8% |
| Interquartile 25% (IQ1) | 8.3% | 20.8% |
| Interquartile 75% (IQ3) | 17.9% | 36.7% |
| Interquartile Range (IQR) | 9.6% | 16.0% |
| Standard Deviation (Sample) | 12.8% | 21.1% |
| Standard Deviation (Population) | 12.7% | 21.1% |
Similar Demographics by Child Poverty Among Boys Under 16
Demographics Similar to Immigrants from Sri Lanka by Child Poverty Among Boys Under 16
In terms of child poverty among boys under 16, the demographic groups most similar to Immigrants from Sri Lanka are Immigrants from Northern Europe (13.9%, a difference of 0.15%), Immigrants from Australia (13.9%, a difference of 0.28%), Luxembourger (13.8%, a difference of 0.41%), Immigrants from Asia (13.9%, a difference of 0.53%), and Lithuanian (14.0%, a difference of 0.61%).
| Demographics | Rating | Rank | Child Poverty Among Boys Under 16 |
| Swedes | 99.8 /100 | #30 | Exceptional 13.6% |
| Turks | 99.8 /100 | #31 | Exceptional 13.6% |
| Immigrants | China | 99.8 /100 | #32 | Exceptional 13.6% |
| Danes | 99.8 /100 | #33 | Exceptional 13.6% |
| Assyrians/Chaldeans/Syriacs | 99.8 /100 | #34 | Exceptional 13.6% |
| Russians | 99.7 /100 | #35 | Exceptional 13.8% |
| Luxembourgers | 99.7 /100 | #36 | Exceptional 13.8% |
| Immigrants | Sri Lanka | 99.6 /100 | #37 | Exceptional 13.9% |
| Immigrants | Northern Europe | 99.6 /100 | #38 | Exceptional 13.9% |
| Immigrants | Australia | 99.6 /100 | #39 | Exceptional 13.9% |
| Immigrants | Asia | 99.6 /100 | #40 | Exceptional 13.9% |
| Lithuanians | 99.6 /100 | #41 | Exceptional 14.0% |
| Koreans | 99.6 /100 | #42 | Exceptional 14.0% |
| Croatians | 99.5 /100 | #43 | Exceptional 14.0% |
| Estonians | 99.4 /100 | #44 | Exceptional 14.1% |
Demographics Similar to Americans by Child Poverty Among Boys Under 16
In terms of child poverty among boys under 16, the demographic groups most similar to Americans are Sudanese (18.6%, a difference of 0.090%), Immigrants from Eritrea (18.6%, a difference of 0.24%), Immigrants from Laos (18.7%, a difference of 0.46%), Nigerian (18.5%, a difference of 0.50%), and Cape Verdean (18.7%, a difference of 0.70%).
| Demographics | Rating | Rank | Child Poverty Among Boys Under 16 |
| Immigrants | Nonimmigrants | 2.2 /100 | #228 | Tragic 18.2% |
| Immigrants | Micronesia | 1.8 /100 | #229 | Tragic 18.3% |
| Fijians | 1.8 /100 | #230 | Tragic 18.3% |
| Nicaraguans | 1.4 /100 | #231 | Tragic 18.4% |
| Marshallese | 1.3 /100 | #232 | Tragic 18.4% |
| Immigrants | Nigeria | 1.2 /100 | #233 | Tragic 18.4% |
| Nigerians | 1.1 /100 | #234 | Tragic 18.5% |
| Americans | 0.9 /100 | #235 | Tragic 18.6% |
| Sudanese | 0.9 /100 | #236 | Tragic 18.6% |
| Immigrants | Eritrea | 0.8 /100 | #237 | Tragic 18.6% |
| Immigrants | Laos | 0.8 /100 | #238 | Tragic 18.7% |
| Cape Verdeans | 0.7 /100 | #239 | Tragic 18.7% |
| Immigrants | Cuba | 0.6 /100 | #240 | Tragic 18.8% |
| Immigrants | Sudan | 0.6 /100 | #241 | Tragic 18.8% |
| Ghanaians | 0.5 /100 | #242 | Tragic 18.9% |