Immigrants from Sri Lanka vs American Disability Age 65 to 74
COMPARE
Immigrants from Sri Lanka
American
Disability Age 65 to 74
Disability Age 65 to 74 Comparison
Immigrants from Sri Lanka
Americans
21.1%
DISABILITY AGE 65 TO 74
99.9/ 100
METRIC RATING
34th/ 347
METRIC RANK
25.8%
DISABILITY AGE 65 TO 74
0.1/ 100
METRIC RATING
274th/ 347
METRIC RANK
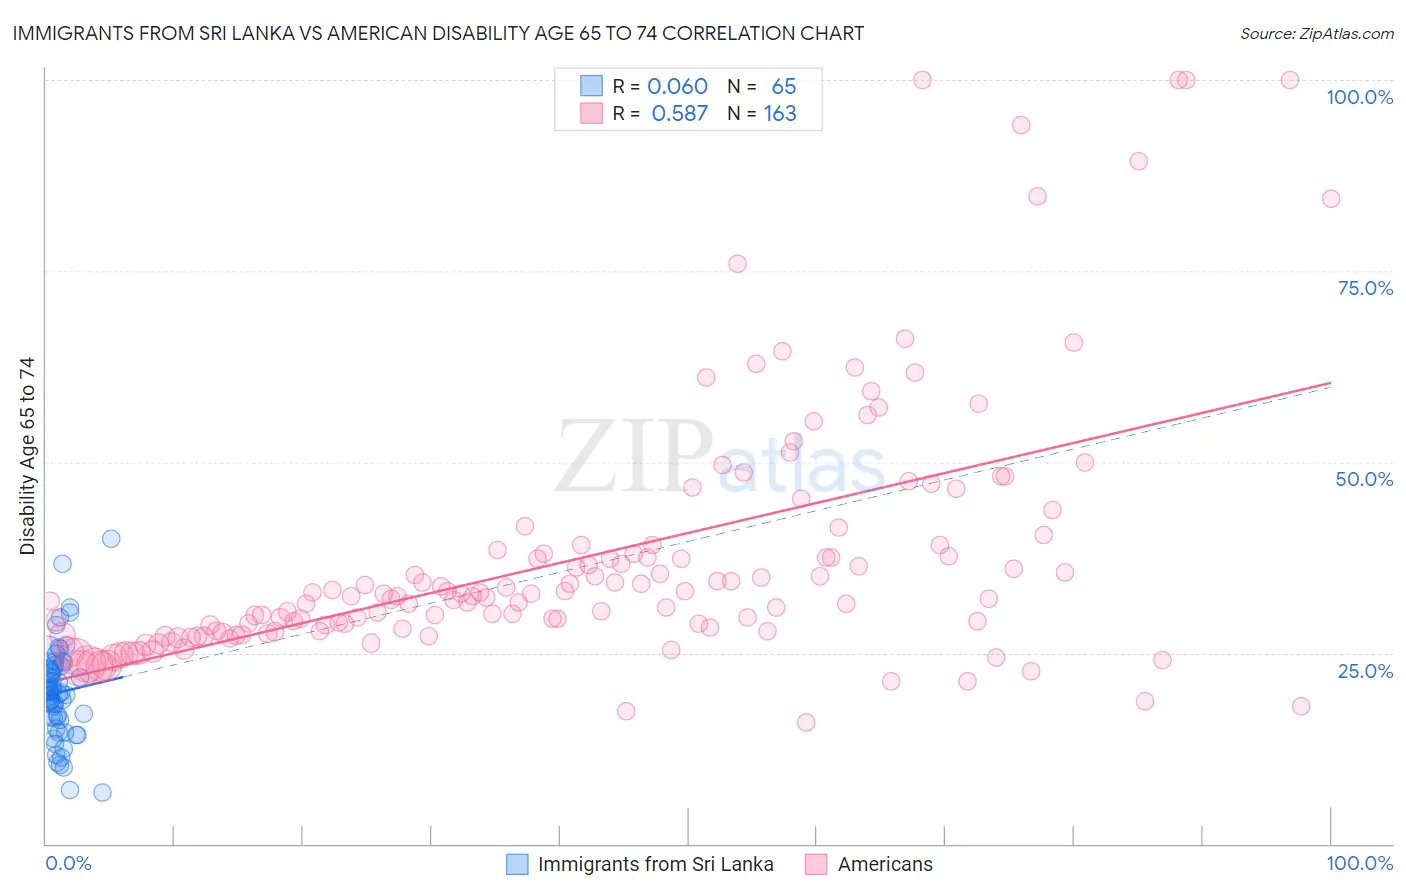
Immigrants from Sri Lanka vs American Disability Age 65 to 74 Correlation Chart
The statistical analysis conducted on geographies consisting of 149,658,794 people shows a slight positive correlation between the proportion of Immigrants from Sri Lanka and percentage of population with a disability between the ages 65 and 75 in the United States with a correlation coefficient (R) of 0.060 and weighted average of 21.1%. Similarly, the statistical analysis conducted on geographies consisting of 579,149,624 people shows a substantial positive correlation between the proportion of Americans and percentage of population with a disability between the ages 65 and 75 in the United States with a correlation coefficient (R) of 0.587 and weighted average of 25.8%, a difference of 22.4%.
Disability Age 65 to 74 Correlation Summary
| Measurement | Immigrants from Sri Lanka | American |
| Minimum | 6.7% | 15.8% |
| Maximum | 39.9% | 100.0% |
| Range | 33.1% | 84.2% |
| Mean | 19.8% | 37.4% |
| Median | 19.8% | 32.3% |
| Interquartile 25% (IQ1) | 16.3% | 27.8% |
| Interquartile 75% (IQ3) | 23.1% | 38.4% |
| Interquartile Range (IQR) | 6.8% | 10.7% |
| Standard Deviation (Sample) | 6.2% | 16.8% |
| Standard Deviation (Population) | 6.2% | 16.7% |
Similar Demographics by Disability Age 65 to 74
Demographics Similar to Immigrants from Sri Lanka by Disability Age 65 to 74
In terms of disability age 65 to 74, the demographic groups most similar to Immigrants from Sri Lanka are Immigrants from Argentina (21.1%, a difference of 0.030%), Bulgarian (21.1%, a difference of 0.050%), Turkish (21.0%, a difference of 0.23%), Immigrants from Switzerland (21.1%, a difference of 0.25%), and Immigrants from Northern Europe (21.0%, a difference of 0.27%).
| Demographics | Rating | Rank | Disability Age 65 to 74 |
| Immigrants | Sweden | 99.9 /100 | #27 | Exceptional 21.0% |
| Immigrants | Czechoslovakia | 99.9 /100 | #28 | Exceptional 21.0% |
| Immigrants | Japan | 99.9 /100 | #29 | Exceptional 21.0% |
| Immigrants | Greece | 99.9 /100 | #30 | Exceptional 21.0% |
| Immigrants | Northern Europe | 99.9 /100 | #31 | Exceptional 21.0% |
| Turks | 99.9 /100 | #32 | Exceptional 21.0% |
| Immigrants | Argentina | 99.9 /100 | #33 | Exceptional 21.1% |
| Immigrants | Sri Lanka | 99.9 /100 | #34 | Exceptional 21.1% |
| Bulgarians | 99.9 /100 | #35 | Exceptional 21.1% |
| Immigrants | Switzerland | 99.8 /100 | #36 | Exceptional 21.1% |
| Israelis | 99.8 /100 | #37 | Exceptional 21.2% |
| Russians | 99.8 /100 | #38 | Exceptional 21.2% |
| Argentineans | 99.8 /100 | #39 | Exceptional 21.2% |
| Latvians | 99.8 /100 | #40 | Exceptional 21.2% |
| Immigrants | Austria | 99.8 /100 | #41 | Exceptional 21.2% |
Demographics Similar to Americans by Disability Age 65 to 74
In terms of disability age 65 to 74, the demographic groups most similar to Americans are Honduran (25.8%, a difference of 0.010%), French American Indian (25.8%, a difference of 0.020%), Belizean (25.8%, a difference of 0.11%), Immigrants from Belize (25.8%, a difference of 0.13%), and U.S. Virgin Islander (25.9%, a difference of 0.21%).
| Demographics | Rating | Rank | Disability Age 65 to 74 |
| Ottawa | 0.1 /100 | #267 | Tragic 25.6% |
| Liberians | 0.1 /100 | #268 | Tragic 25.6% |
| Hmong | 0.1 /100 | #269 | Tragic 25.7% |
| Immigrants | Guatemala | 0.1 /100 | #270 | Tragic 25.7% |
| Immigrants | Liberia | 0.1 /100 | #271 | Tragic 25.7% |
| Immigrants | Dominica | 0.1 /100 | #272 | Tragic 25.7% |
| Japanese | 0.1 /100 | #273 | Tragic 25.7% |
| Americans | 0.1 /100 | #274 | Tragic 25.8% |
| Hondurans | 0.1 /100 | #275 | Tragic 25.8% |
| French American Indians | 0.1 /100 | #276 | Tragic 25.8% |
| Belizeans | 0.1 /100 | #277 | Tragic 25.8% |
| Immigrants | Belize | 0.1 /100 | #278 | Tragic 25.8% |
| U.S. Virgin Islanders | 0.1 /100 | #279 | Tragic 25.9% |
| Cree | 0.1 /100 | #280 | Tragic 25.9% |
| Immigrants | Honduras | 0.1 /100 | #281 | Tragic 25.9% |