Immigrants from Spain vs Chilean Child Poverty Among Boys Under 16
COMPARE
Immigrants from Spain
Chilean
Child Poverty Among Boys Under 16
Child Poverty Among Boys Under 16 Comparison
Immigrants from Spain
Chileans
15.6%
CHILD POVERTY AMONG BOYS UNDER 16
87.1/ 100
METRIC RATING
137th/ 347
METRIC RANK
15.0%
CHILD POVERTY AMONG BOYS UNDER 16
95.8/ 100
METRIC RATING
100th/ 347
METRIC RANK
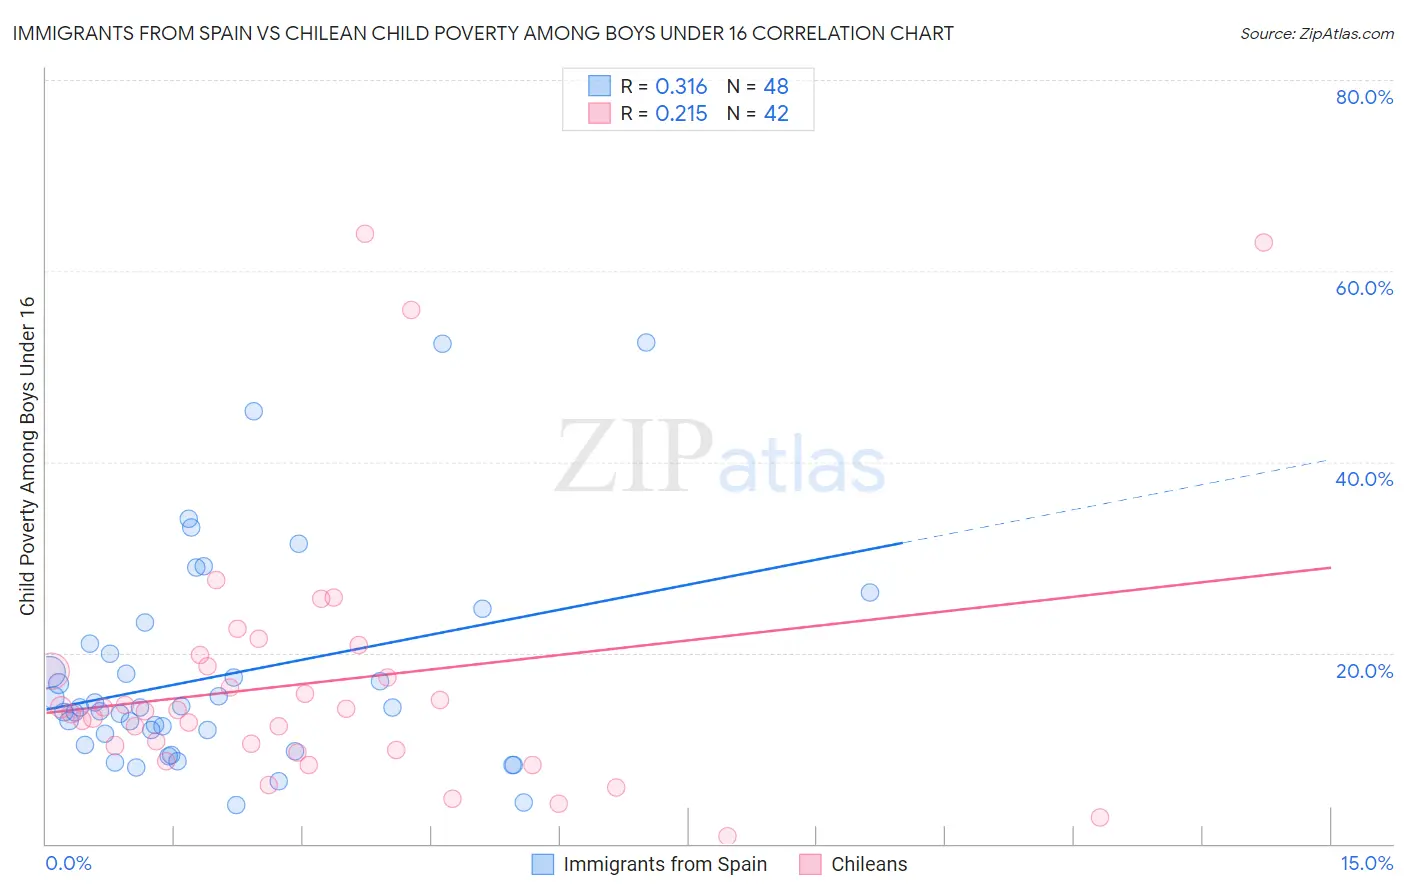
Immigrants from Spain vs Chilean Child Poverty Among Boys Under 16 Correlation Chart
The statistical analysis conducted on geographies consisting of 236,961,391 people shows a mild positive correlation between the proportion of Immigrants from Spain and poverty level among boys under the age of 16 in the United States with a correlation coefficient (R) of 0.316 and weighted average of 15.6%. Similarly, the statistical analysis conducted on geographies consisting of 254,368,720 people shows a weak positive correlation between the proportion of Chileans and poverty level among boys under the age of 16 in the United States with a correlation coefficient (R) of 0.215 and weighted average of 15.0%, a difference of 3.7%.
Child Poverty Among Boys Under 16 Correlation Summary
| Measurement | Immigrants from Spain | Chilean |
| Minimum | 4.0% | 0.79% |
| Maximum | 52.5% | 63.9% |
| Range | 48.5% | 63.1% |
| Mean | 17.7% | 16.9% |
| Median | 14.2% | 13.9% |
| Interquartile 25% (IQ1) | 10.9% | 9.8% |
| Interquartile 75% (IQ3) | 20.4% | 18.6% |
| Interquartile Range (IQR) | 9.5% | 8.8% |
| Standard Deviation (Sample) | 11.1% | 13.8% |
| Standard Deviation (Population) | 11.0% | 13.6% |
Similar Demographics by Child Poverty Among Boys Under 16
Demographics Similar to Immigrants from Spain by Child Poverty Among Boys Under 16
In terms of child poverty among boys under 16, the demographic groups most similar to Immigrants from Spain are Icelander (15.5%, a difference of 0.10%), Portuguese (15.5%, a difference of 0.11%), Immigrants from Southern Europe (15.6%, a difference of 0.15%), Albanian (15.6%, a difference of 0.15%), and Peruvian (15.5%, a difference of 0.29%).
| Demographics | Rating | Rank | Child Poverty Among Boys Under 16 |
| Mongolians | 90.2 /100 | #130 | Exceptional 15.4% |
| Immigrants | Western Europe | 90.0 /100 | #131 | Exceptional 15.4% |
| Immigrants | Kazakhstan | 88.7 /100 | #132 | Excellent 15.5% |
| Welsh | 88.3 /100 | #133 | Excellent 15.5% |
| Peruvians | 88.1 /100 | #134 | Excellent 15.5% |
| Portuguese | 87.5 /100 | #135 | Excellent 15.5% |
| Icelanders | 87.5 /100 | #136 | Excellent 15.5% |
| Immigrants | Spain | 87.1 /100 | #137 | Excellent 15.6% |
| Immigrants | Southern Europe | 86.5 /100 | #138 | Excellent 15.6% |
| Albanians | 86.5 /100 | #139 | Excellent 15.6% |
| Immigrants | Kuwait | 85.6 /100 | #140 | Excellent 15.6% |
| Slavs | 84.5 /100 | #141 | Excellent 15.7% |
| Immigrants | Hungary | 84.1 /100 | #142 | Excellent 15.7% |
| Immigrants | Fiji | 83.6 /100 | #143 | Excellent 15.7% |
| Immigrants | Peru | 83.5 /100 | #144 | Excellent 15.7% |
Demographics Similar to Chileans by Child Poverty Among Boys Under 16
In terms of child poverty among boys under 16, the demographic groups most similar to Chileans are Immigrants from Belarus (15.0%, a difference of 0.050%), Romanian (15.0%, a difference of 0.13%), Immigrants from Denmark (15.0%, a difference of 0.17%), Immigrants from France (15.0%, a difference of 0.24%), and Immigrants from Switzerland (15.0%, a difference of 0.26%).
| Demographics | Rating | Rank | Child Poverty Among Boys Under 16 |
| Sri Lankans | 96.7 /100 | #93 | Exceptional 14.9% |
| Immigrants | Italy | 96.7 /100 | #94 | Exceptional 14.9% |
| Finns | 96.5 /100 | #95 | Exceptional 14.9% |
| Immigrants | North Macedonia | 96.3 /100 | #96 | Exceptional 14.9% |
| Immigrants | Egypt | 96.2 /100 | #97 | Exceptional 14.9% |
| British | 96.2 /100 | #98 | Exceptional 15.0% |
| Immigrants | France | 96.1 /100 | #99 | Exceptional 15.0% |
| Chileans | 95.8 /100 | #100 | Exceptional 15.0% |
| Immigrants | Belarus | 95.7 /100 | #101 | Exceptional 15.0% |
| Romanians | 95.6 /100 | #102 | Exceptional 15.0% |
| Immigrants | Denmark | 95.6 /100 | #103 | Exceptional 15.0% |
| Immigrants | Switzerland | 95.4 /100 | #104 | Exceptional 15.0% |
| Dutch | 95.4 /100 | #105 | Exceptional 15.0% |
| Serbians | 95.2 /100 | #106 | Exceptional 15.1% |
| Jordanians | 95.1 /100 | #107 | Exceptional 15.1% |